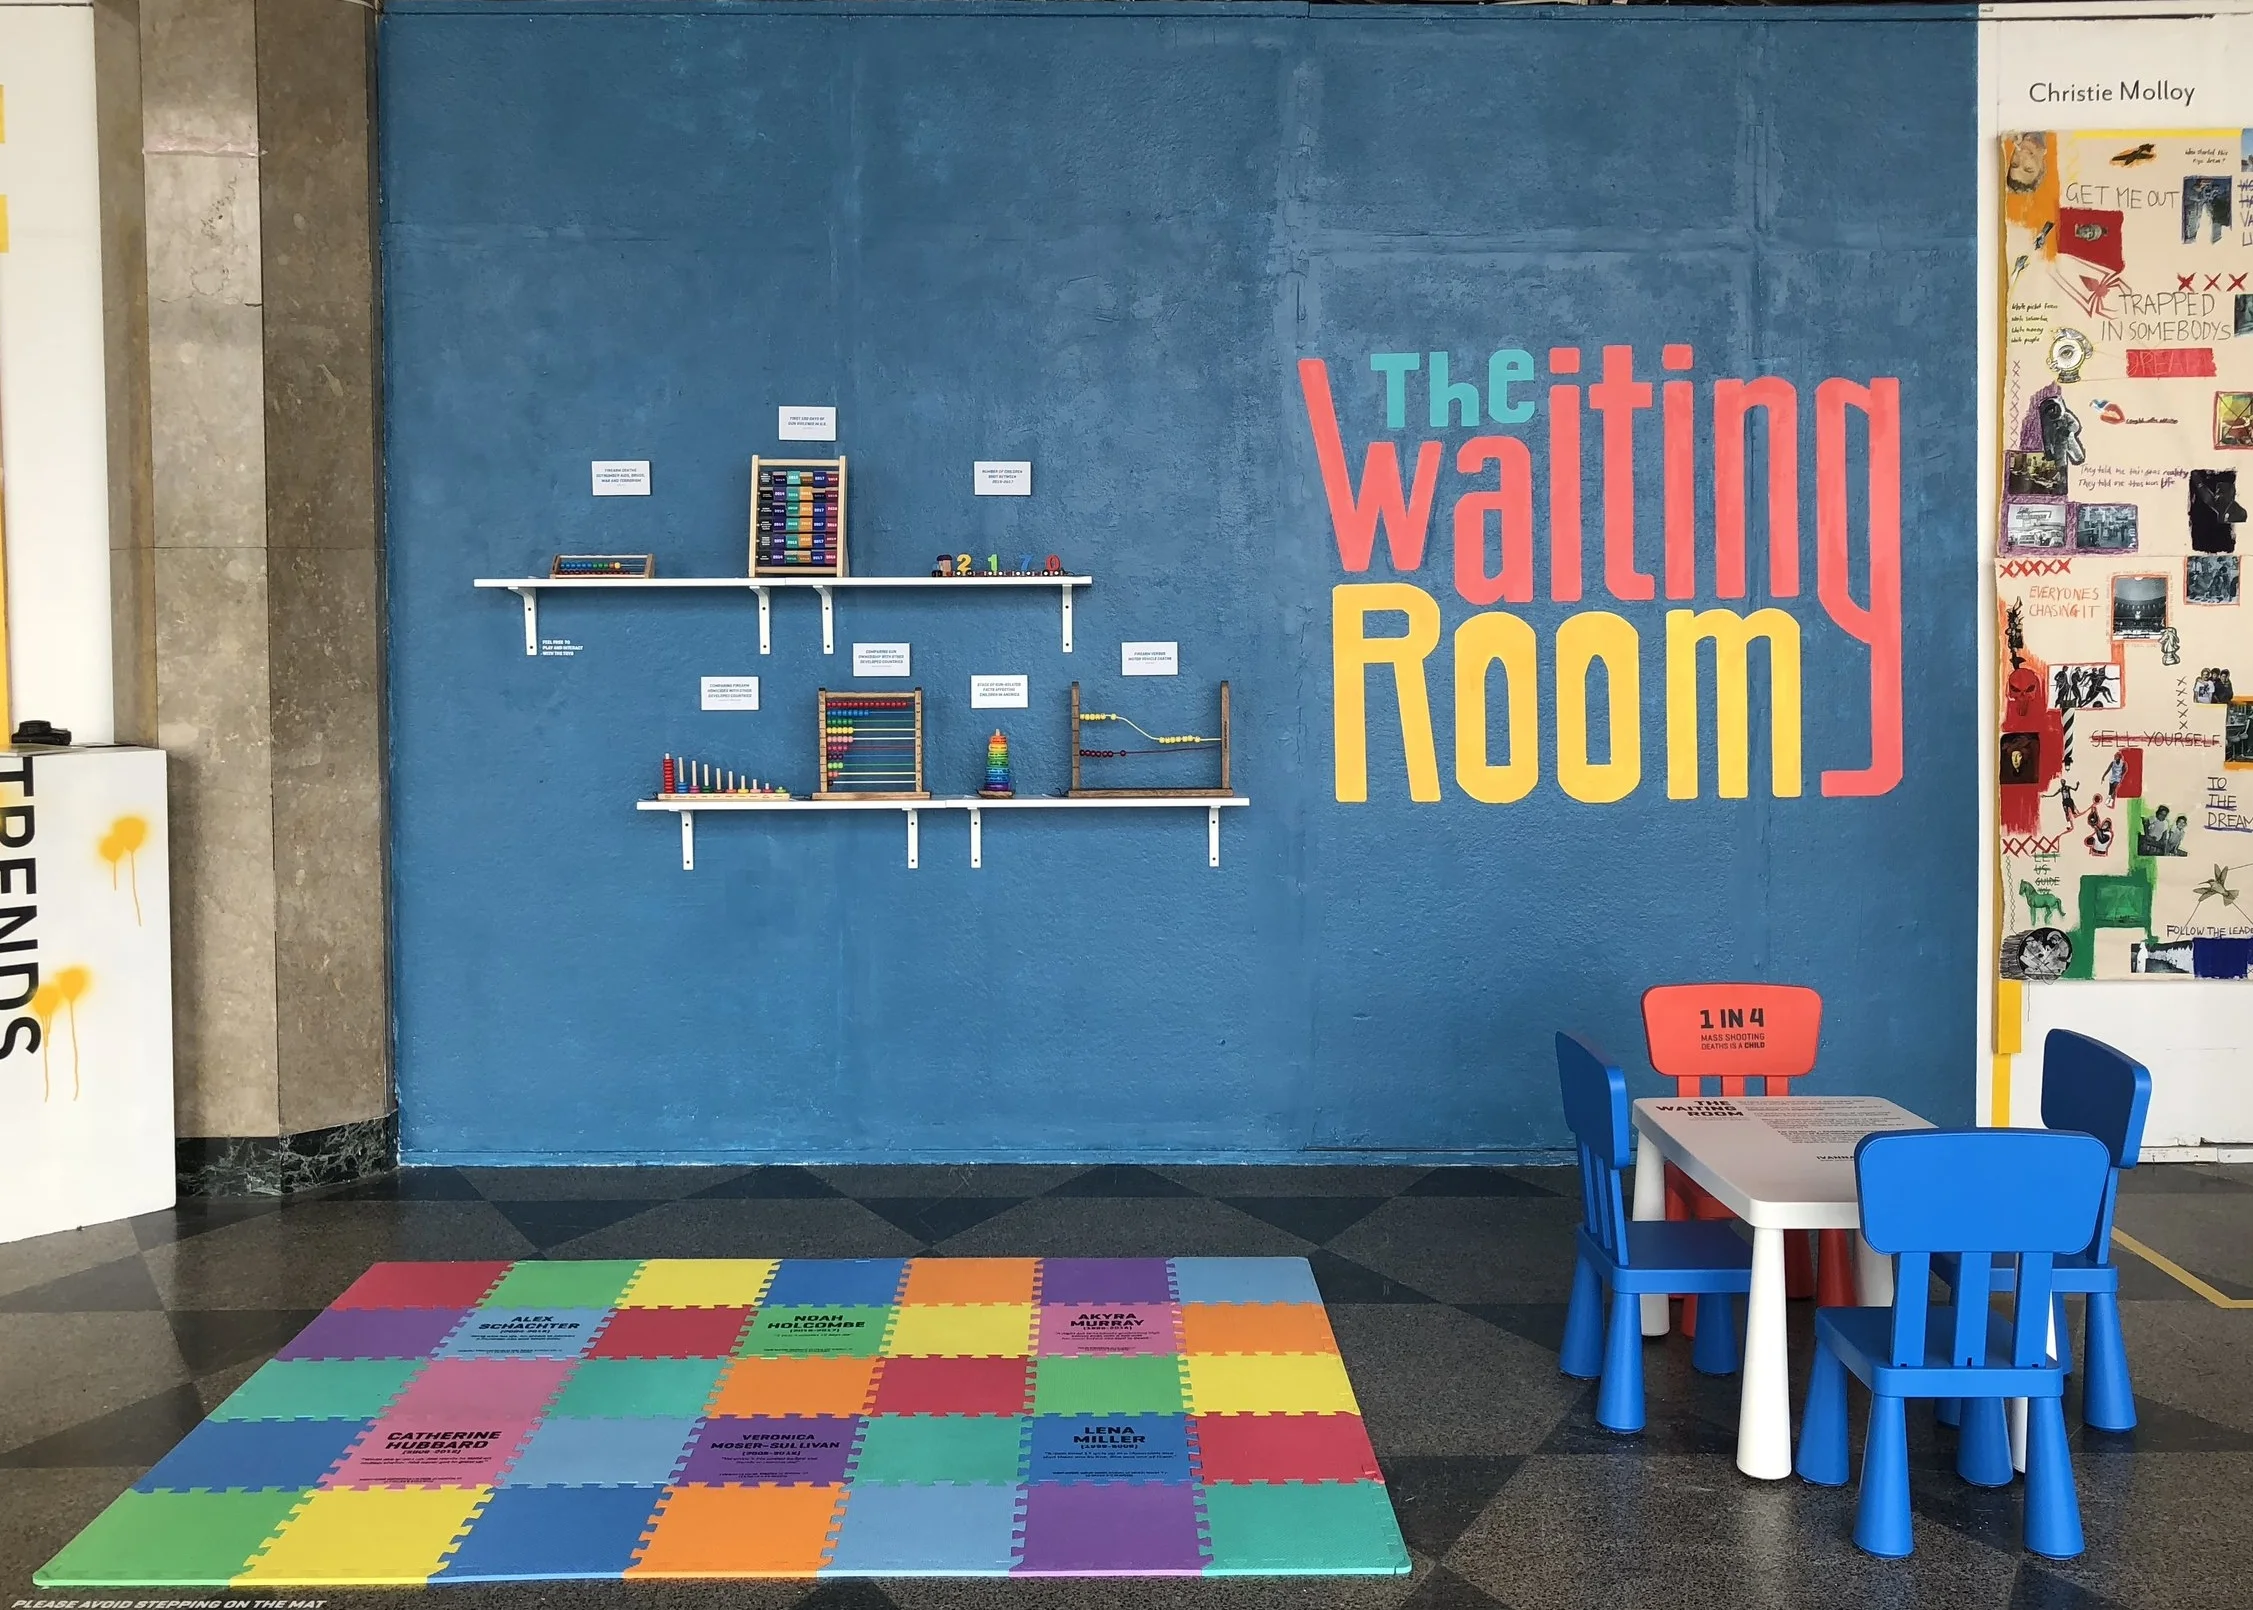
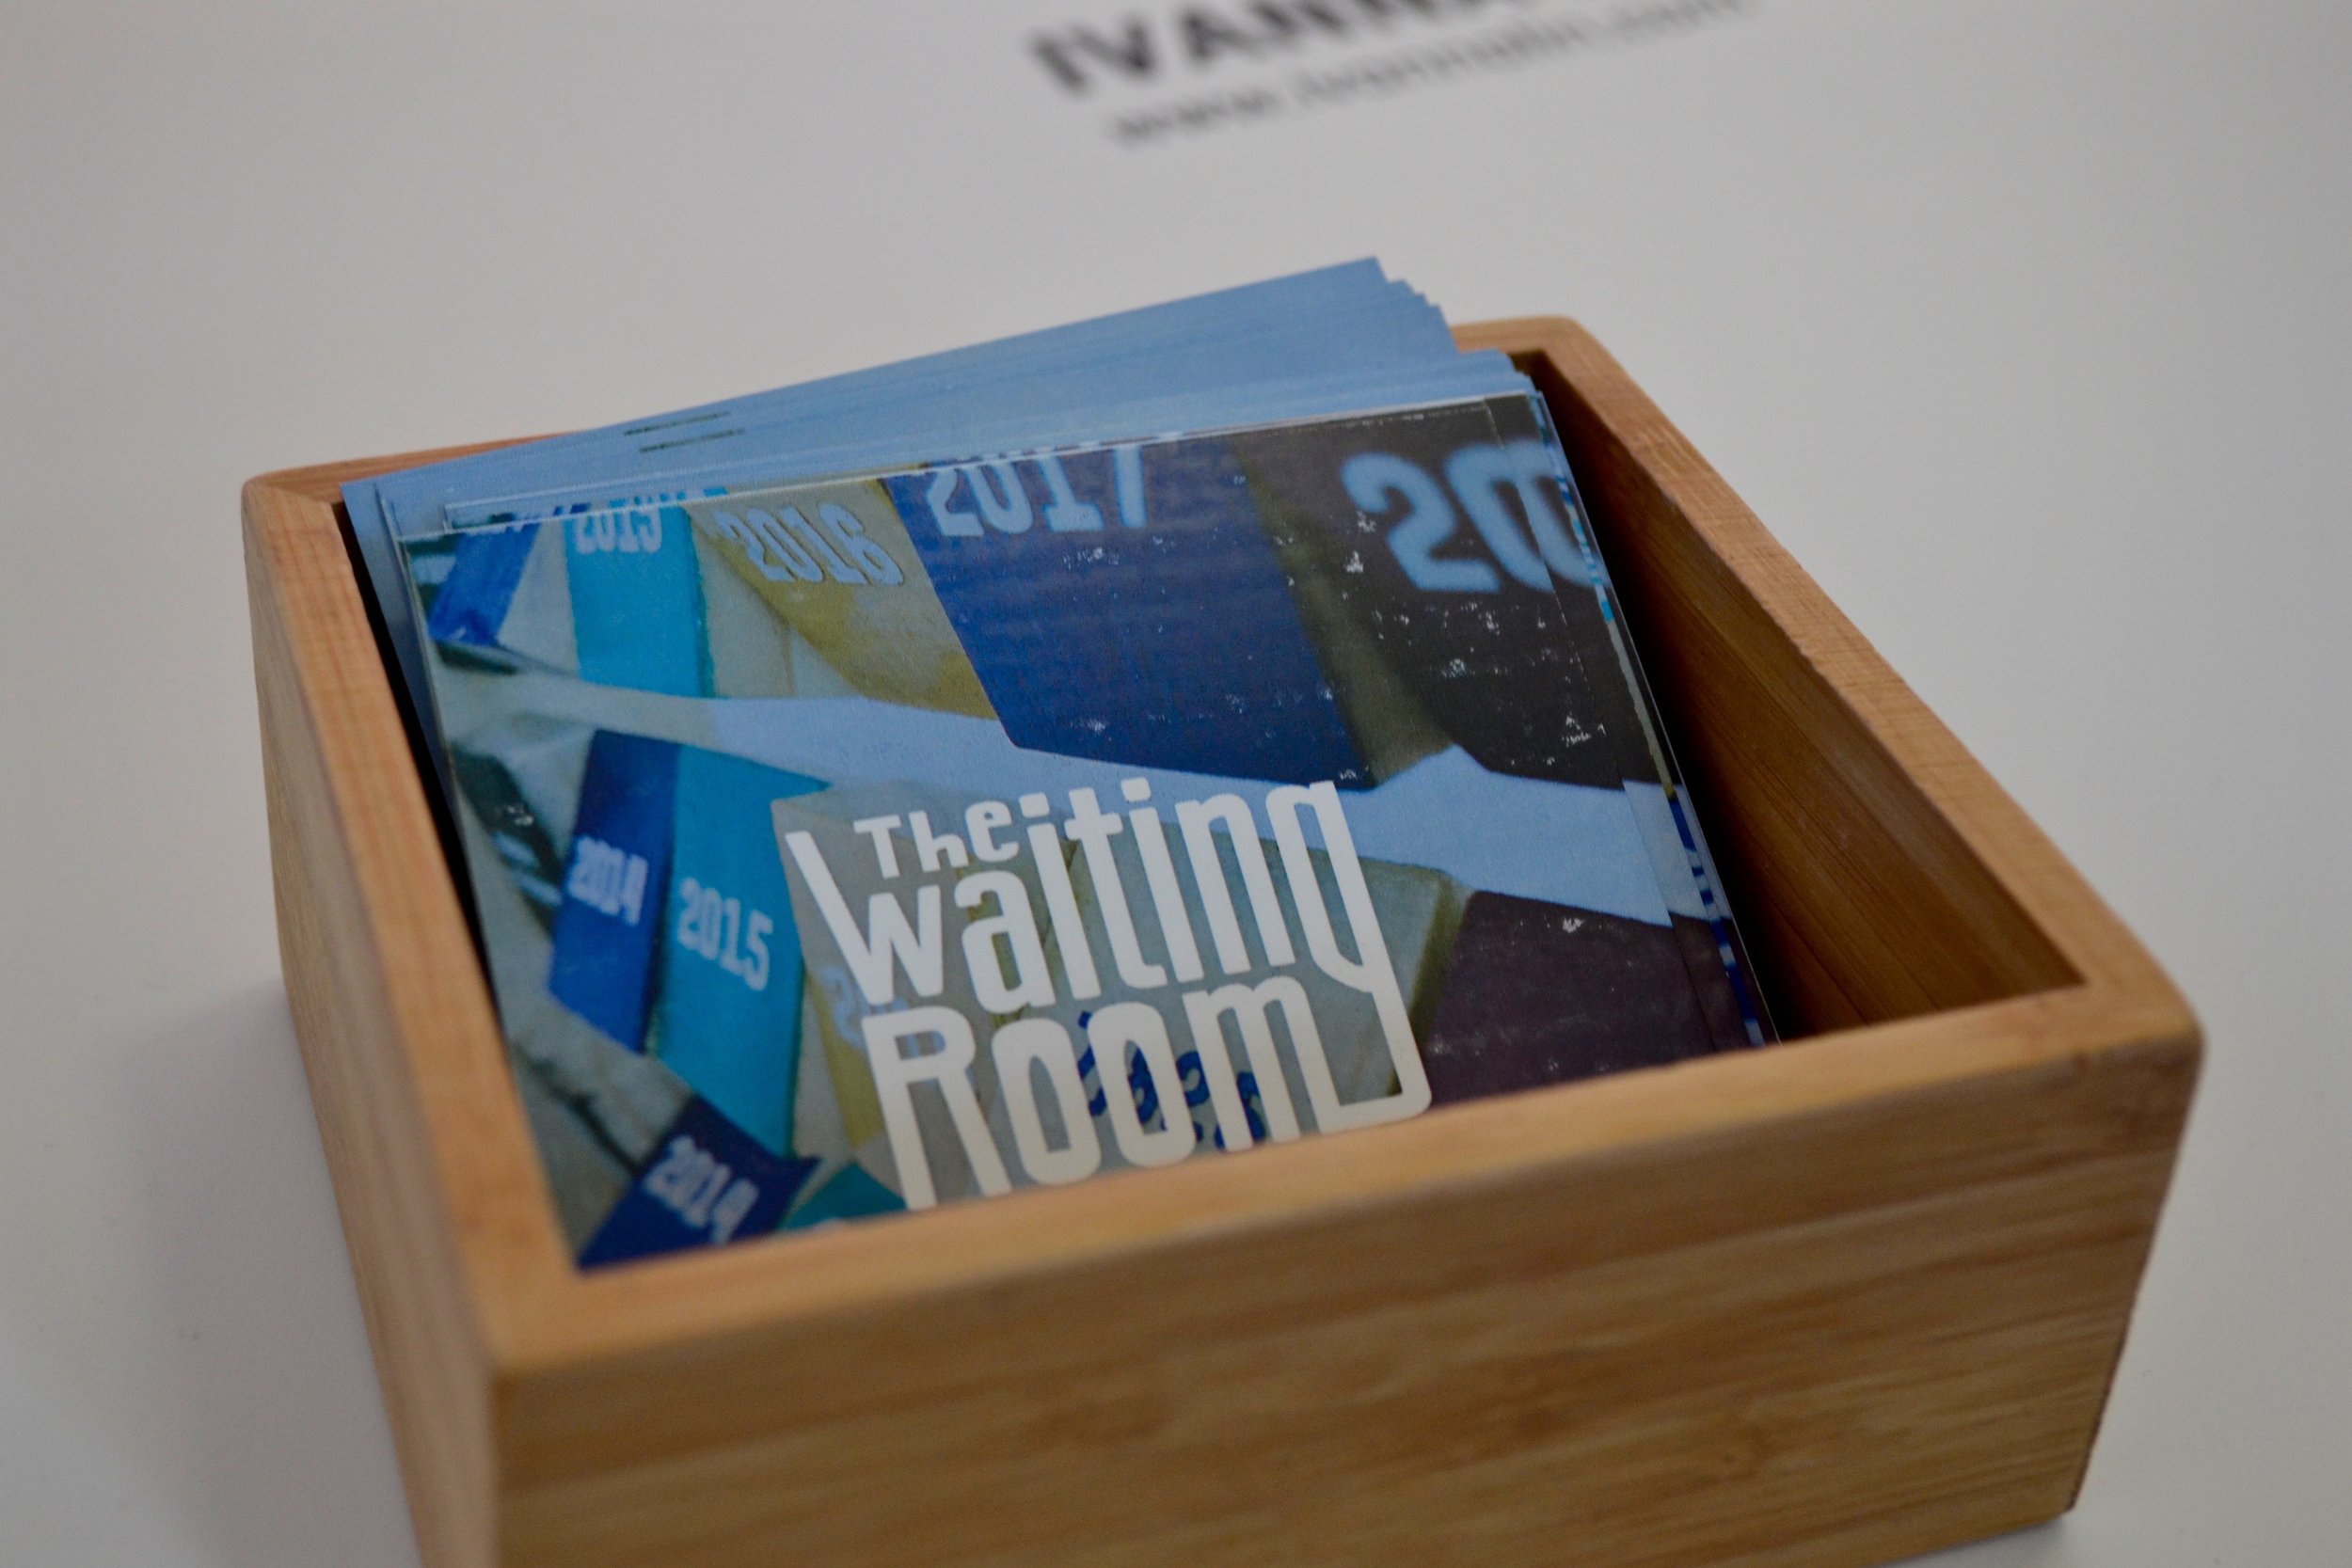
The Waiting Room
(Data Visualization on Gun Violence in America)
58th hatch awards: gold | semifinalist @2018 adobe design achievement awards | installation
The Idea: We face numbers and data on a daily basis. How much of it actually leaves an impact on us? Data is powerful, but it’s more powerful when it’s humanized and experiential. The Waiting Room is an exploration of unique ways to display data points on gun violence in America. Why gun violence? The high number of gun-related tragedies has proved that this is an on-going problem in our country that needs to be tackled. The worst part is that children are affected by it.
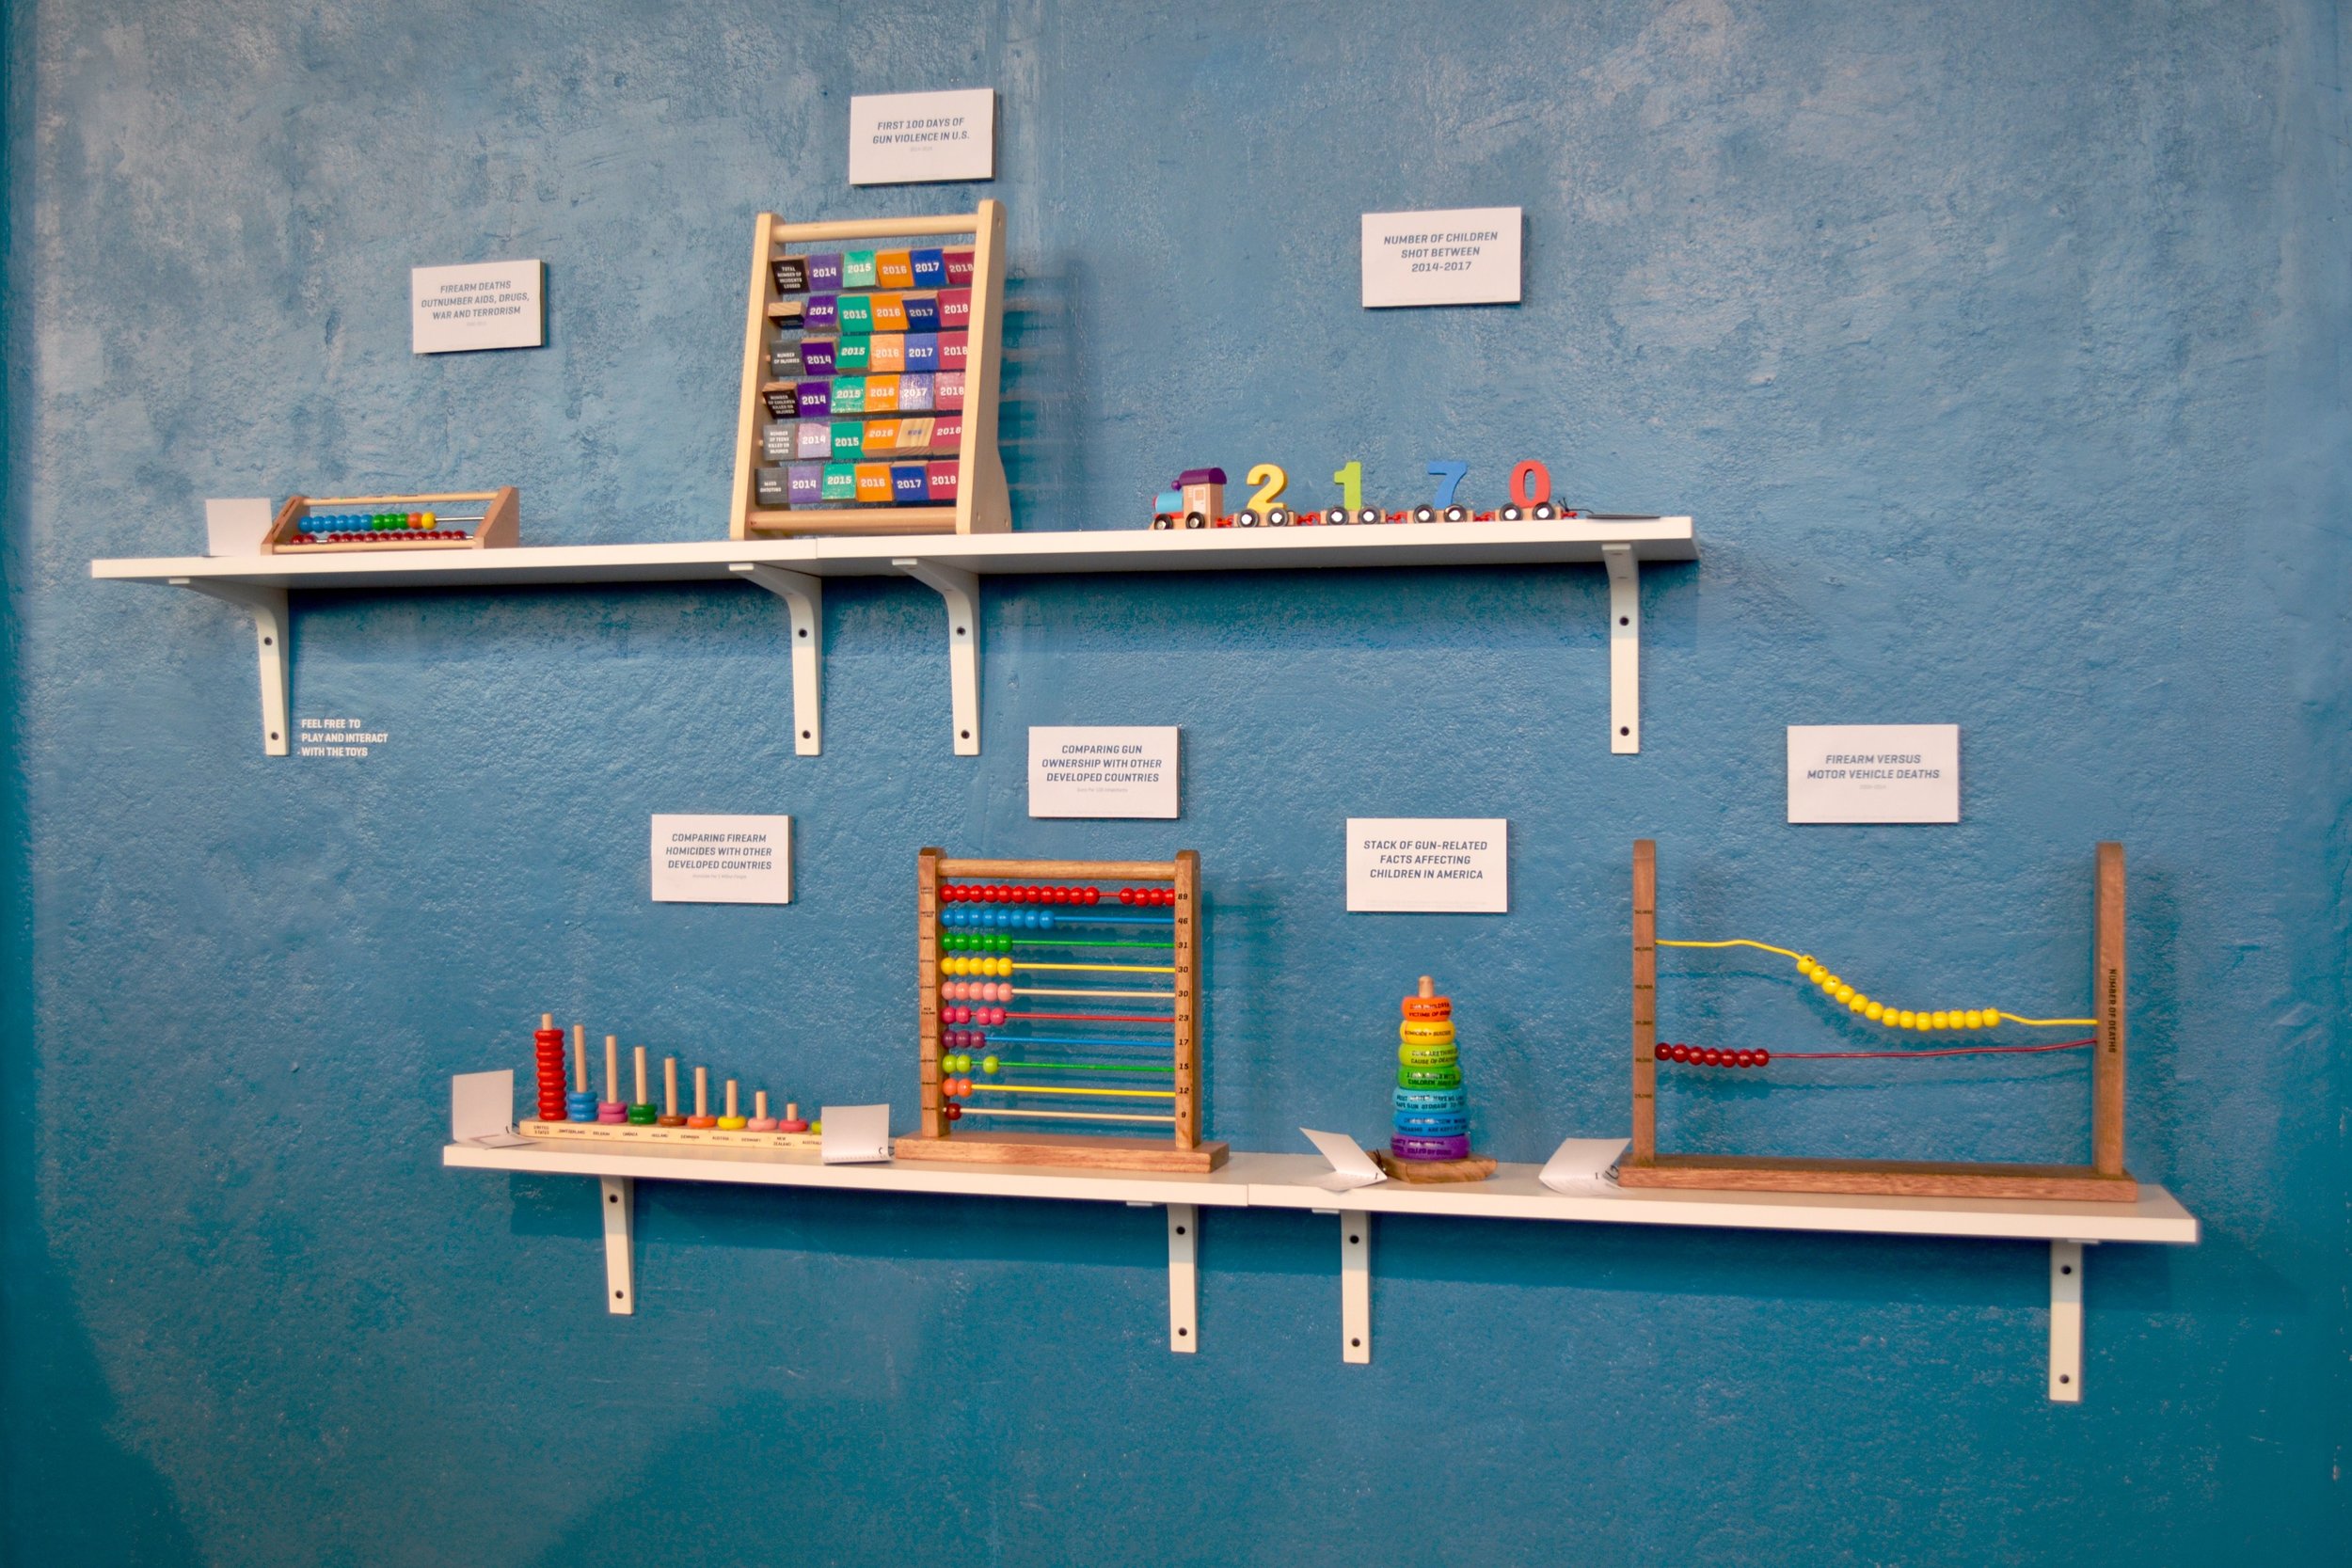
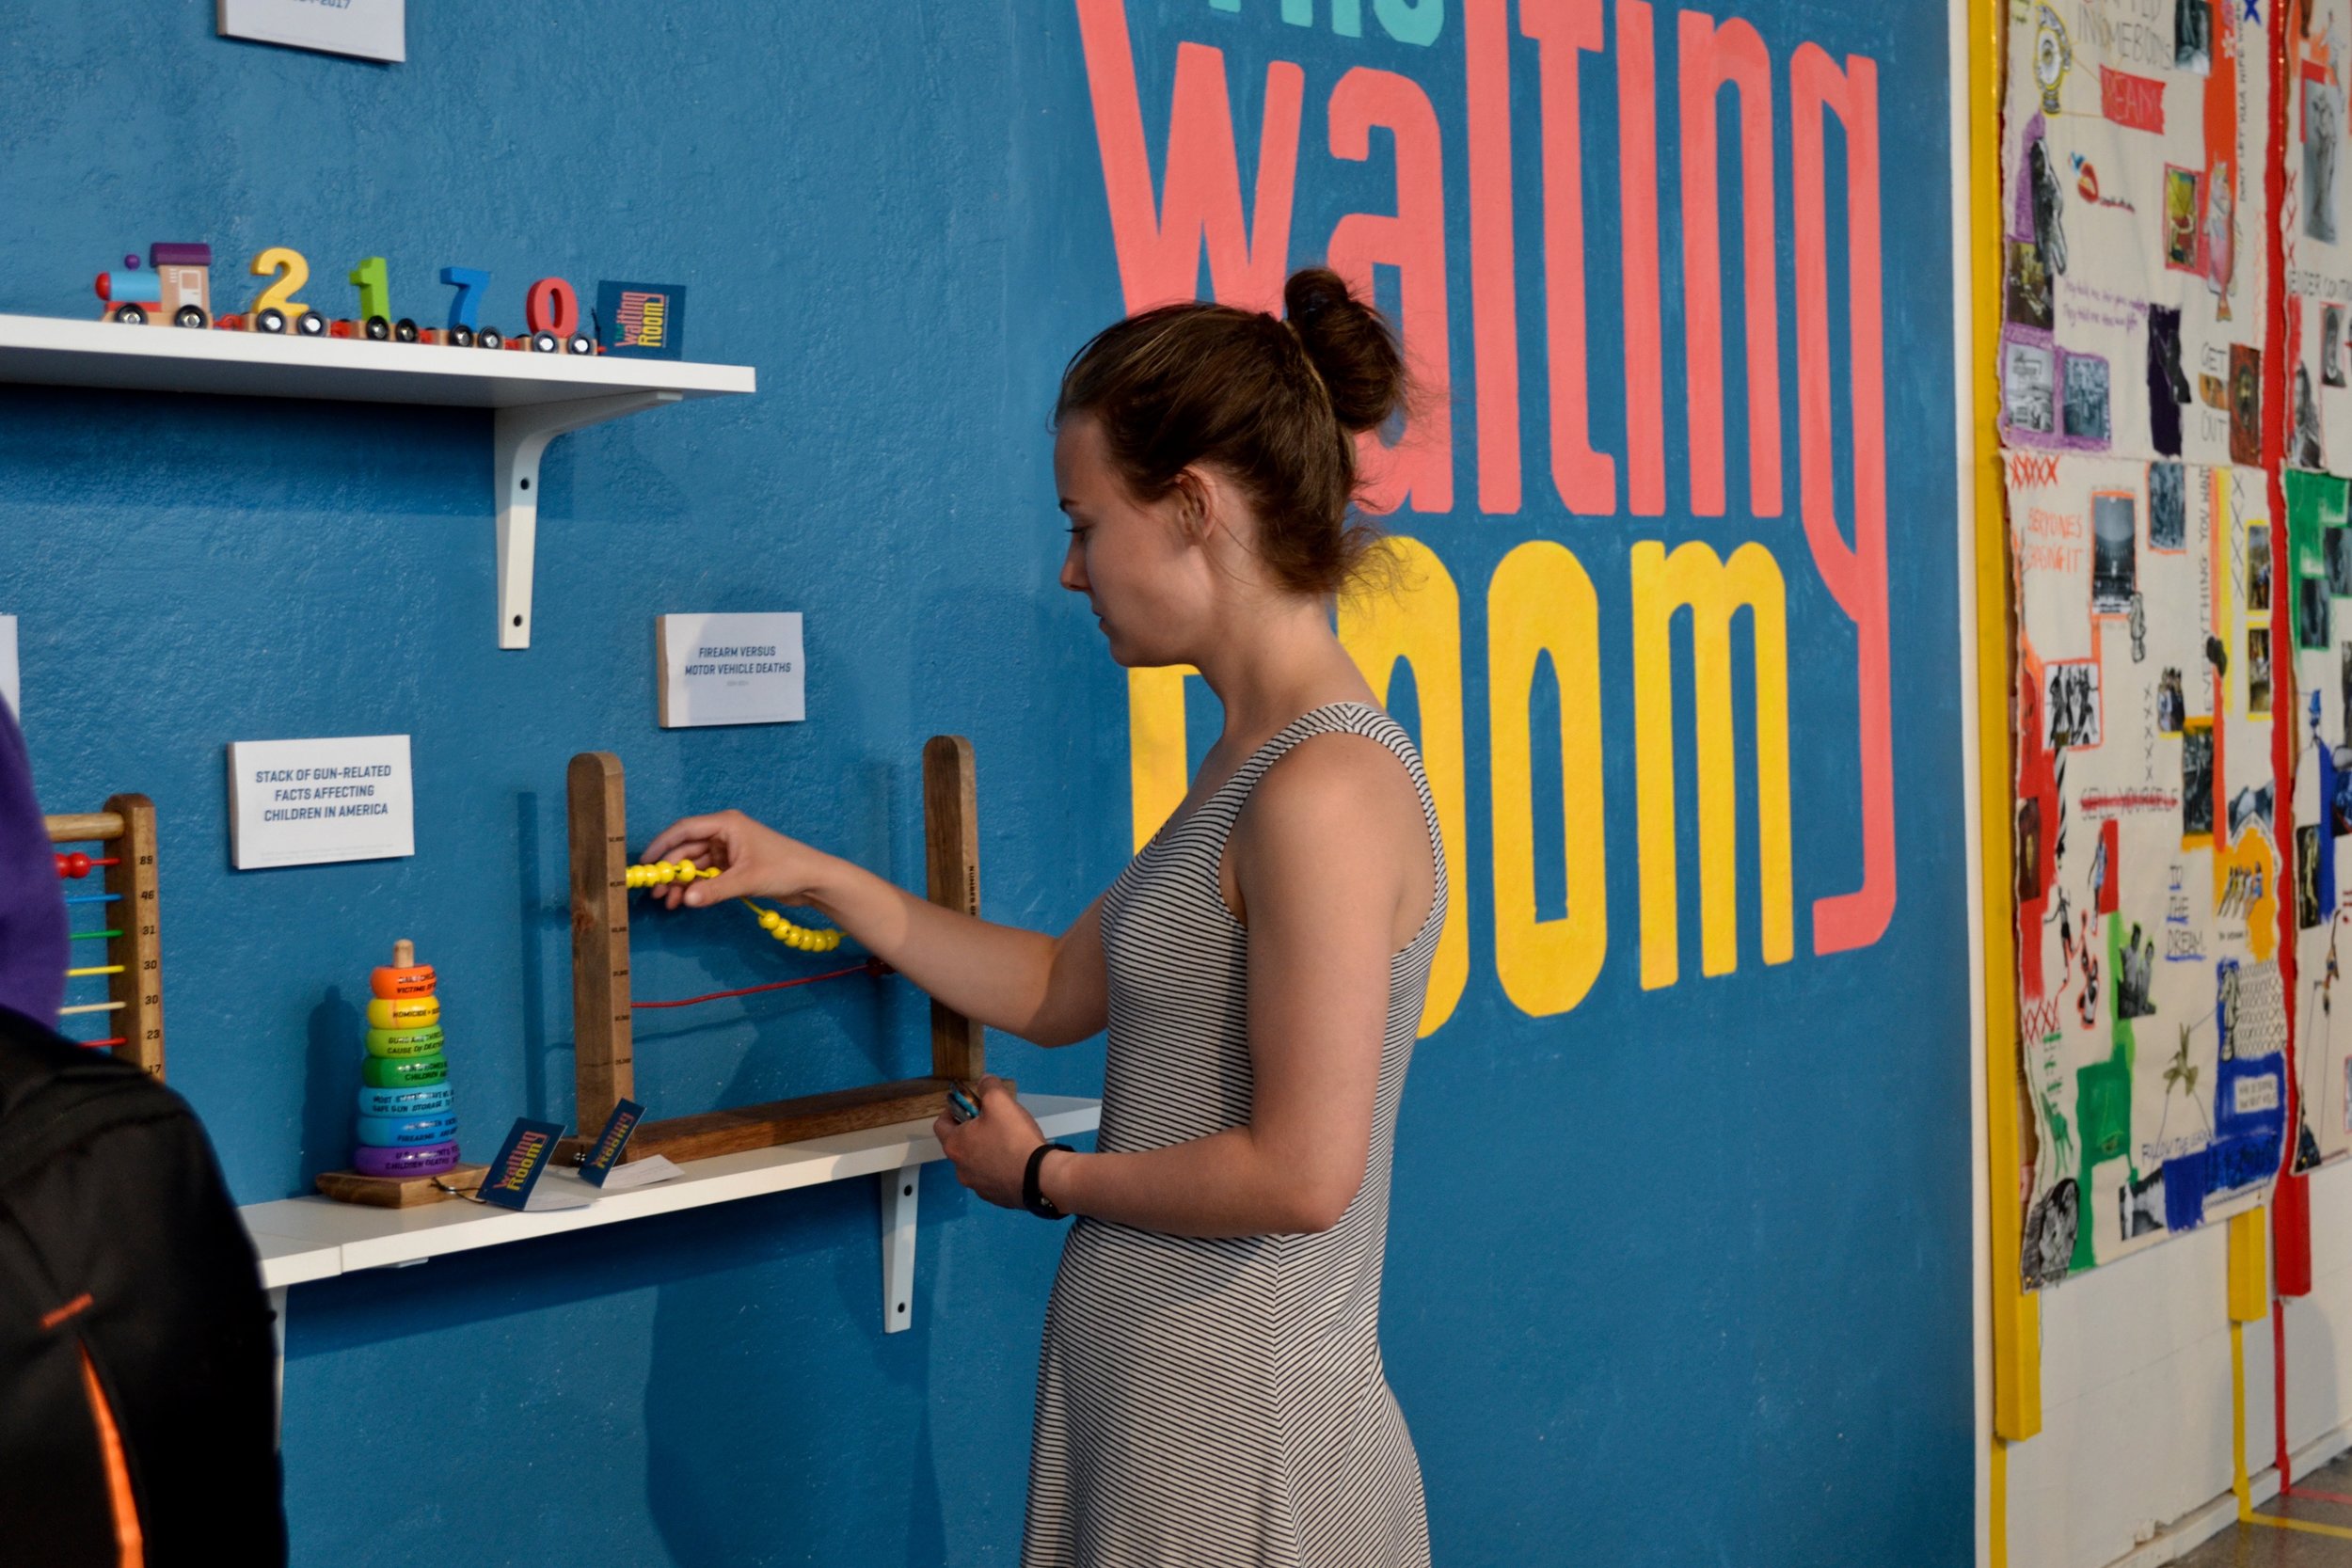
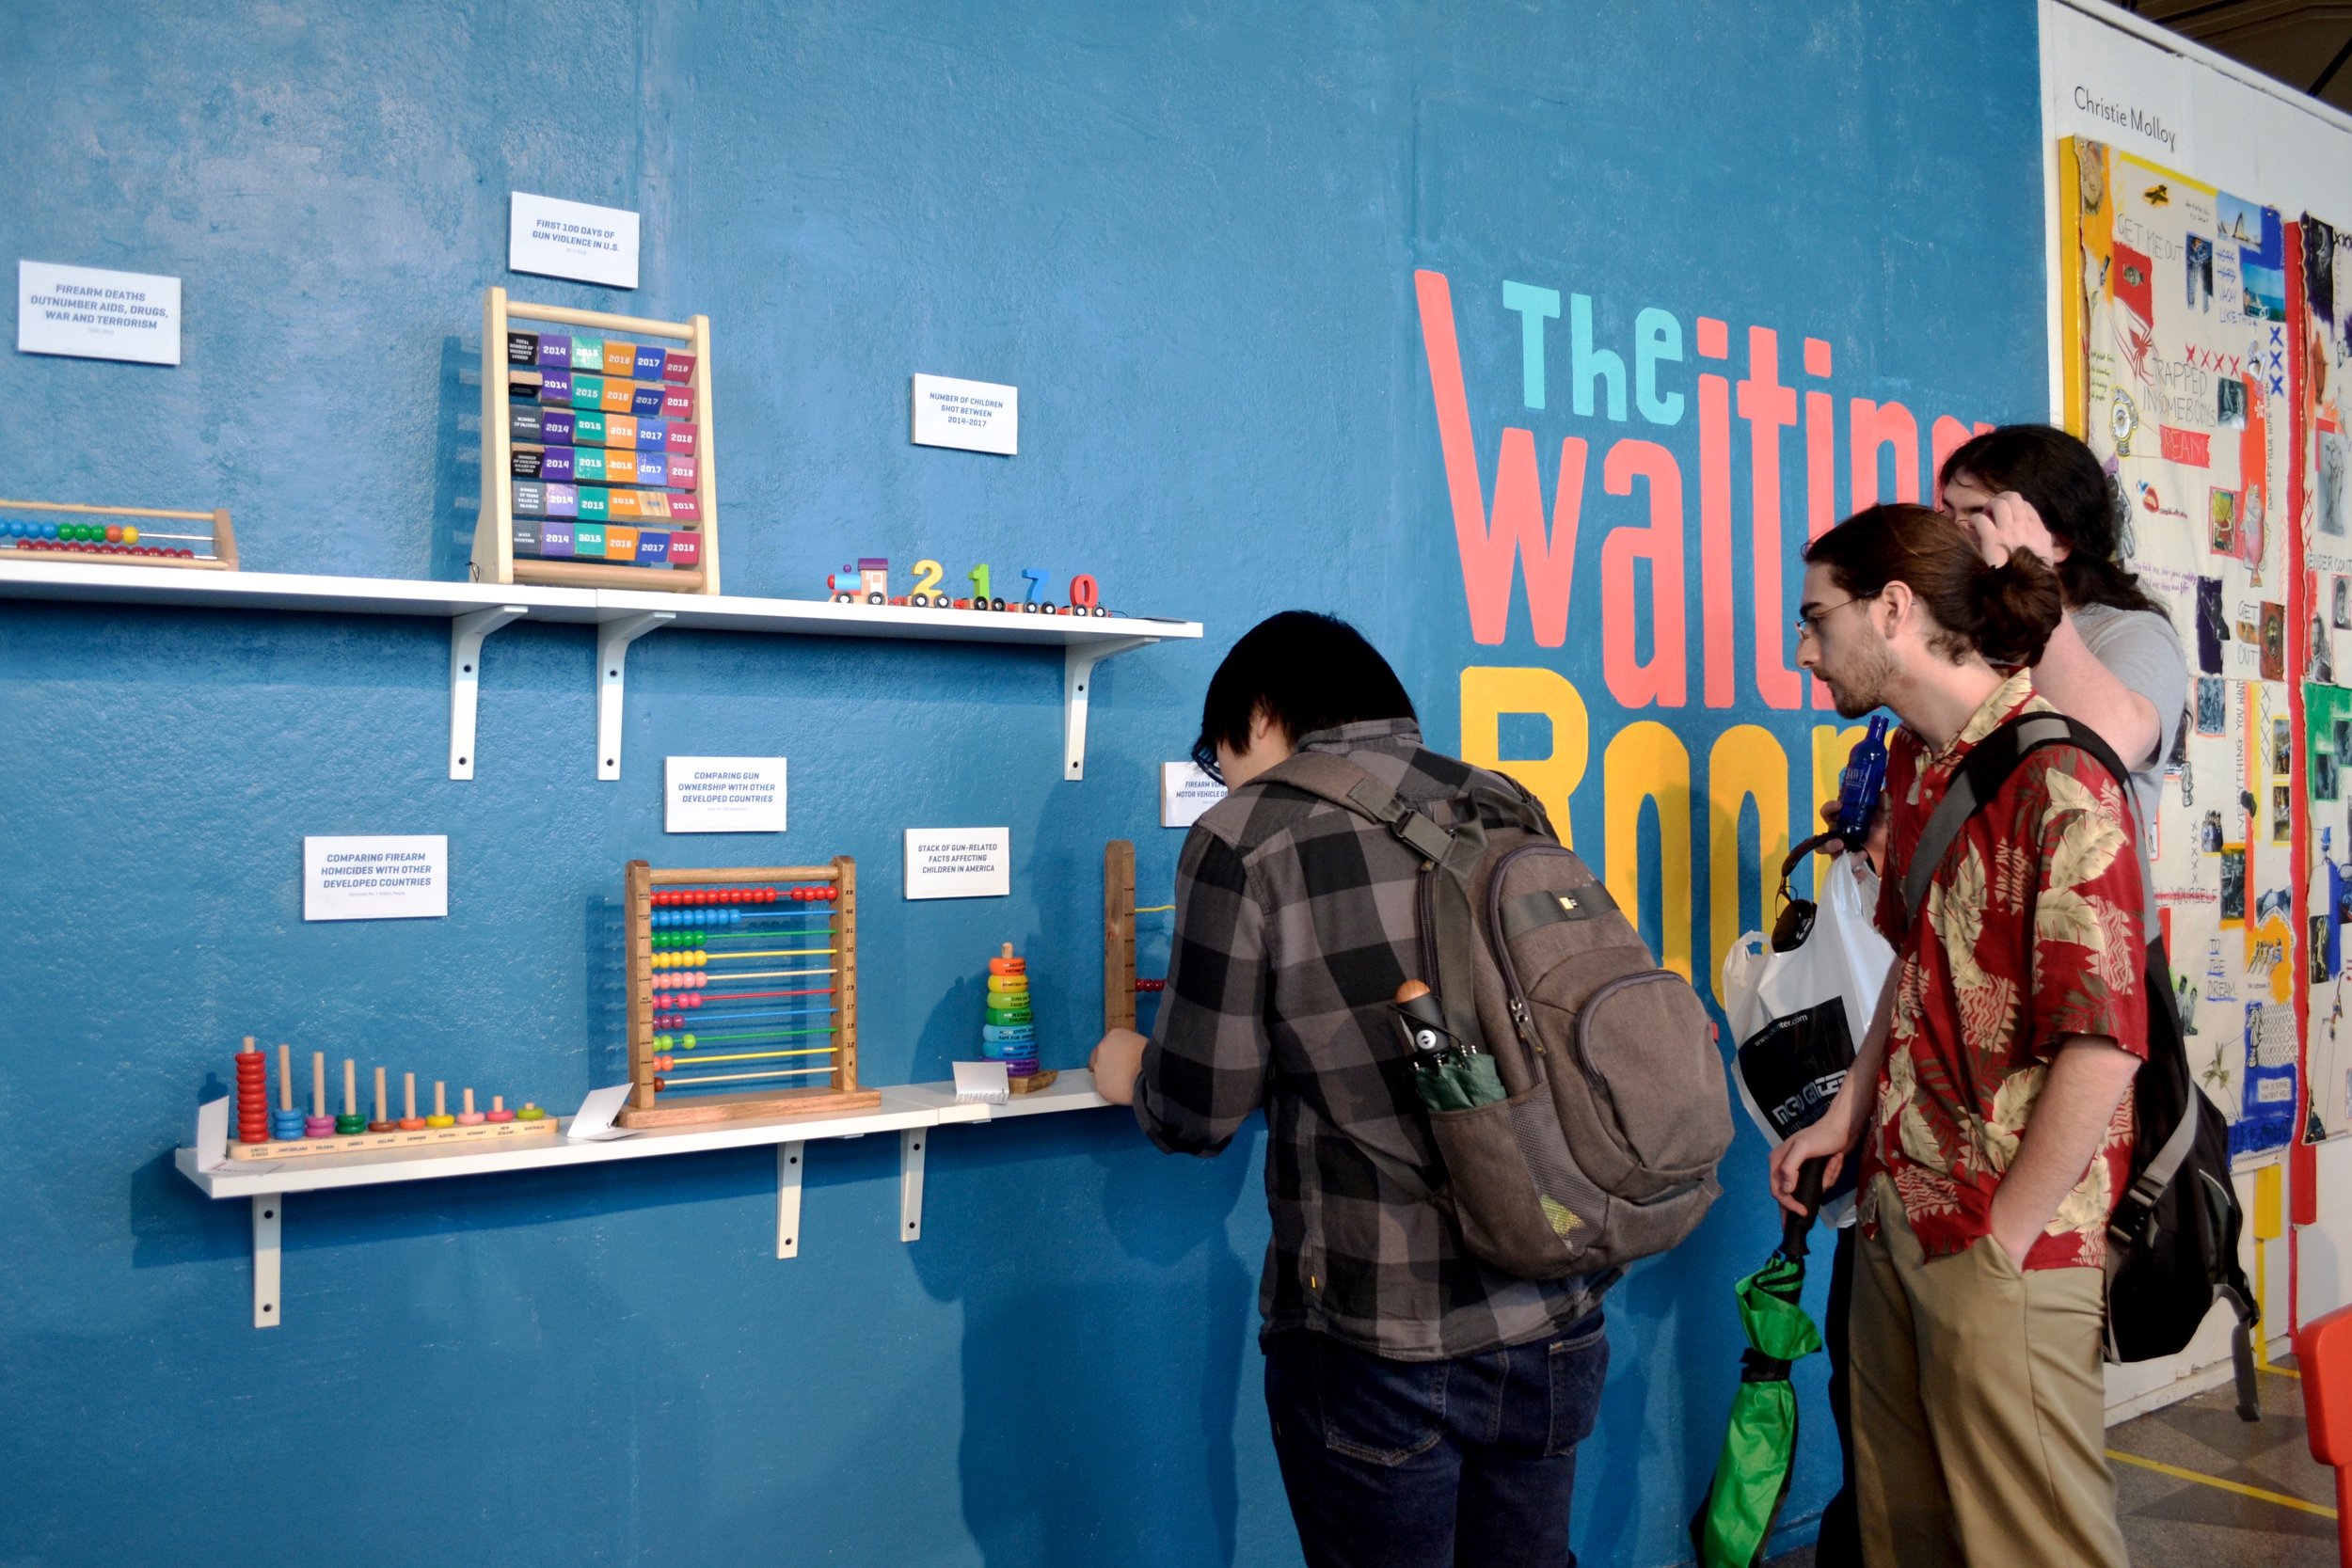
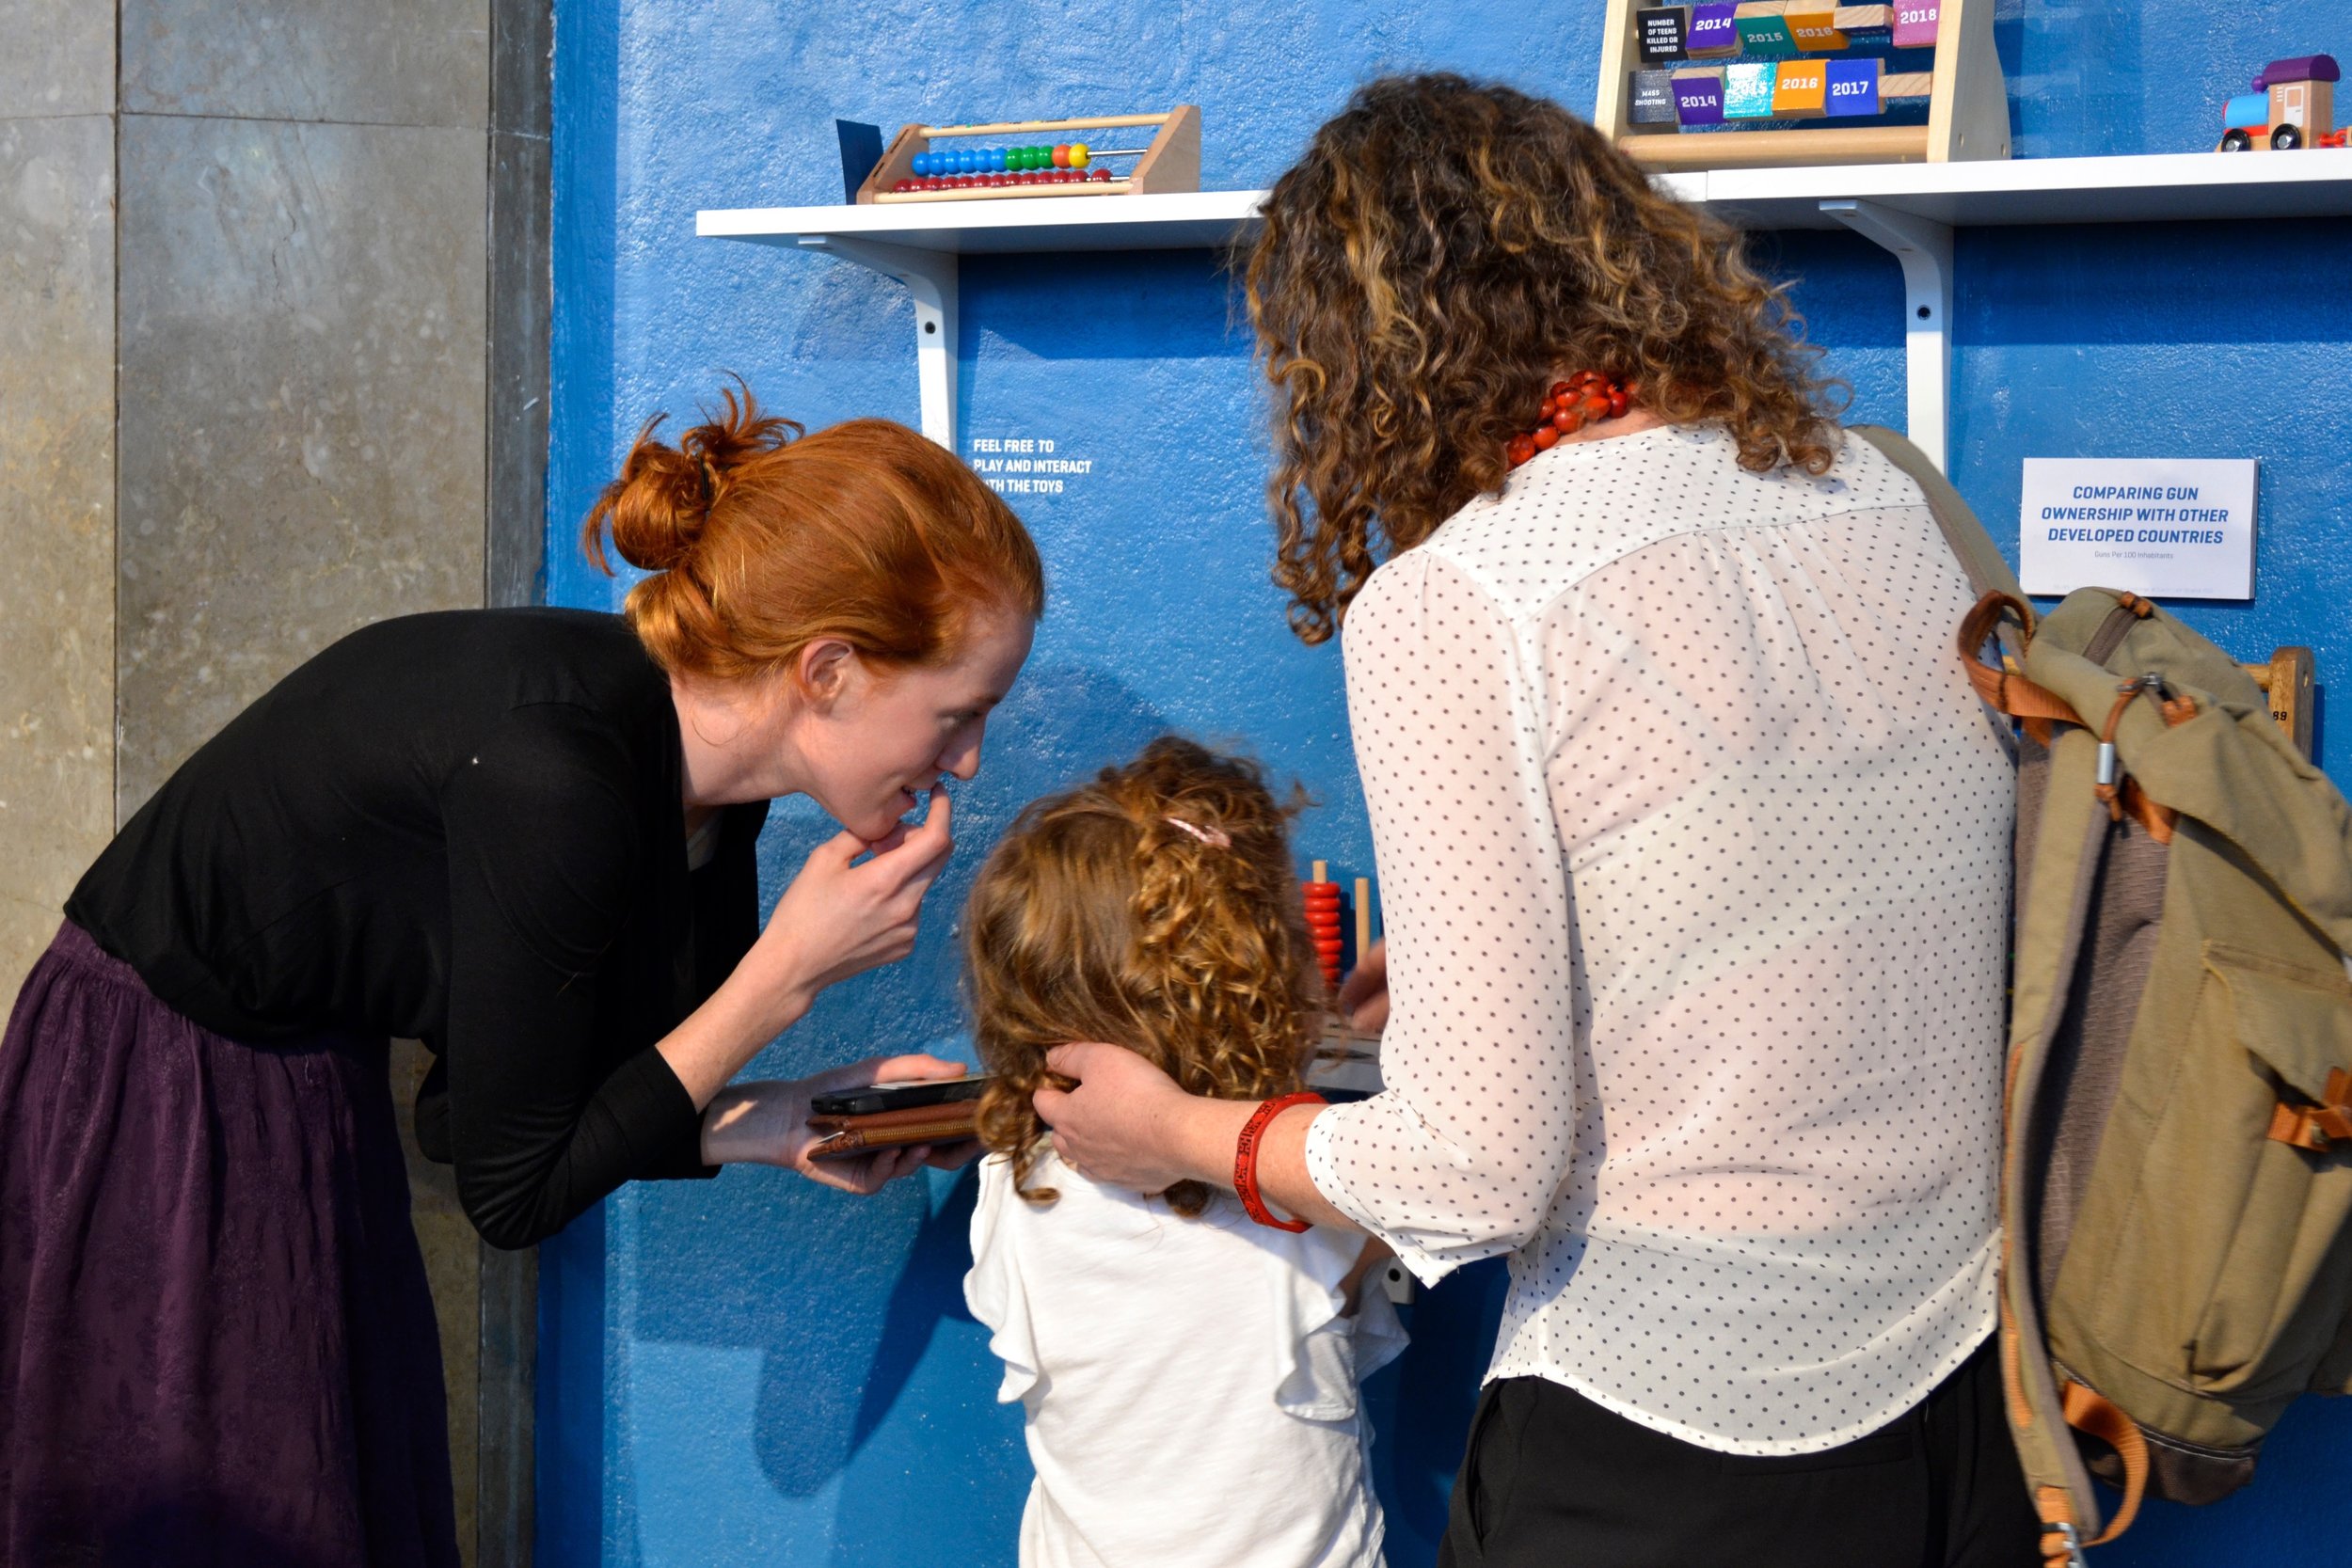
For my installation, I decided to appropriate kids’ toys as a form of data visualization.
I discovered a lot of visual similarities between classic wooden toys and traditional data graphs. By merging the two forms, I hope to give new meanings to these data points and leave an impact on my audience.
Filmed by: Thien Dam | Edited by: Ivanna Lin





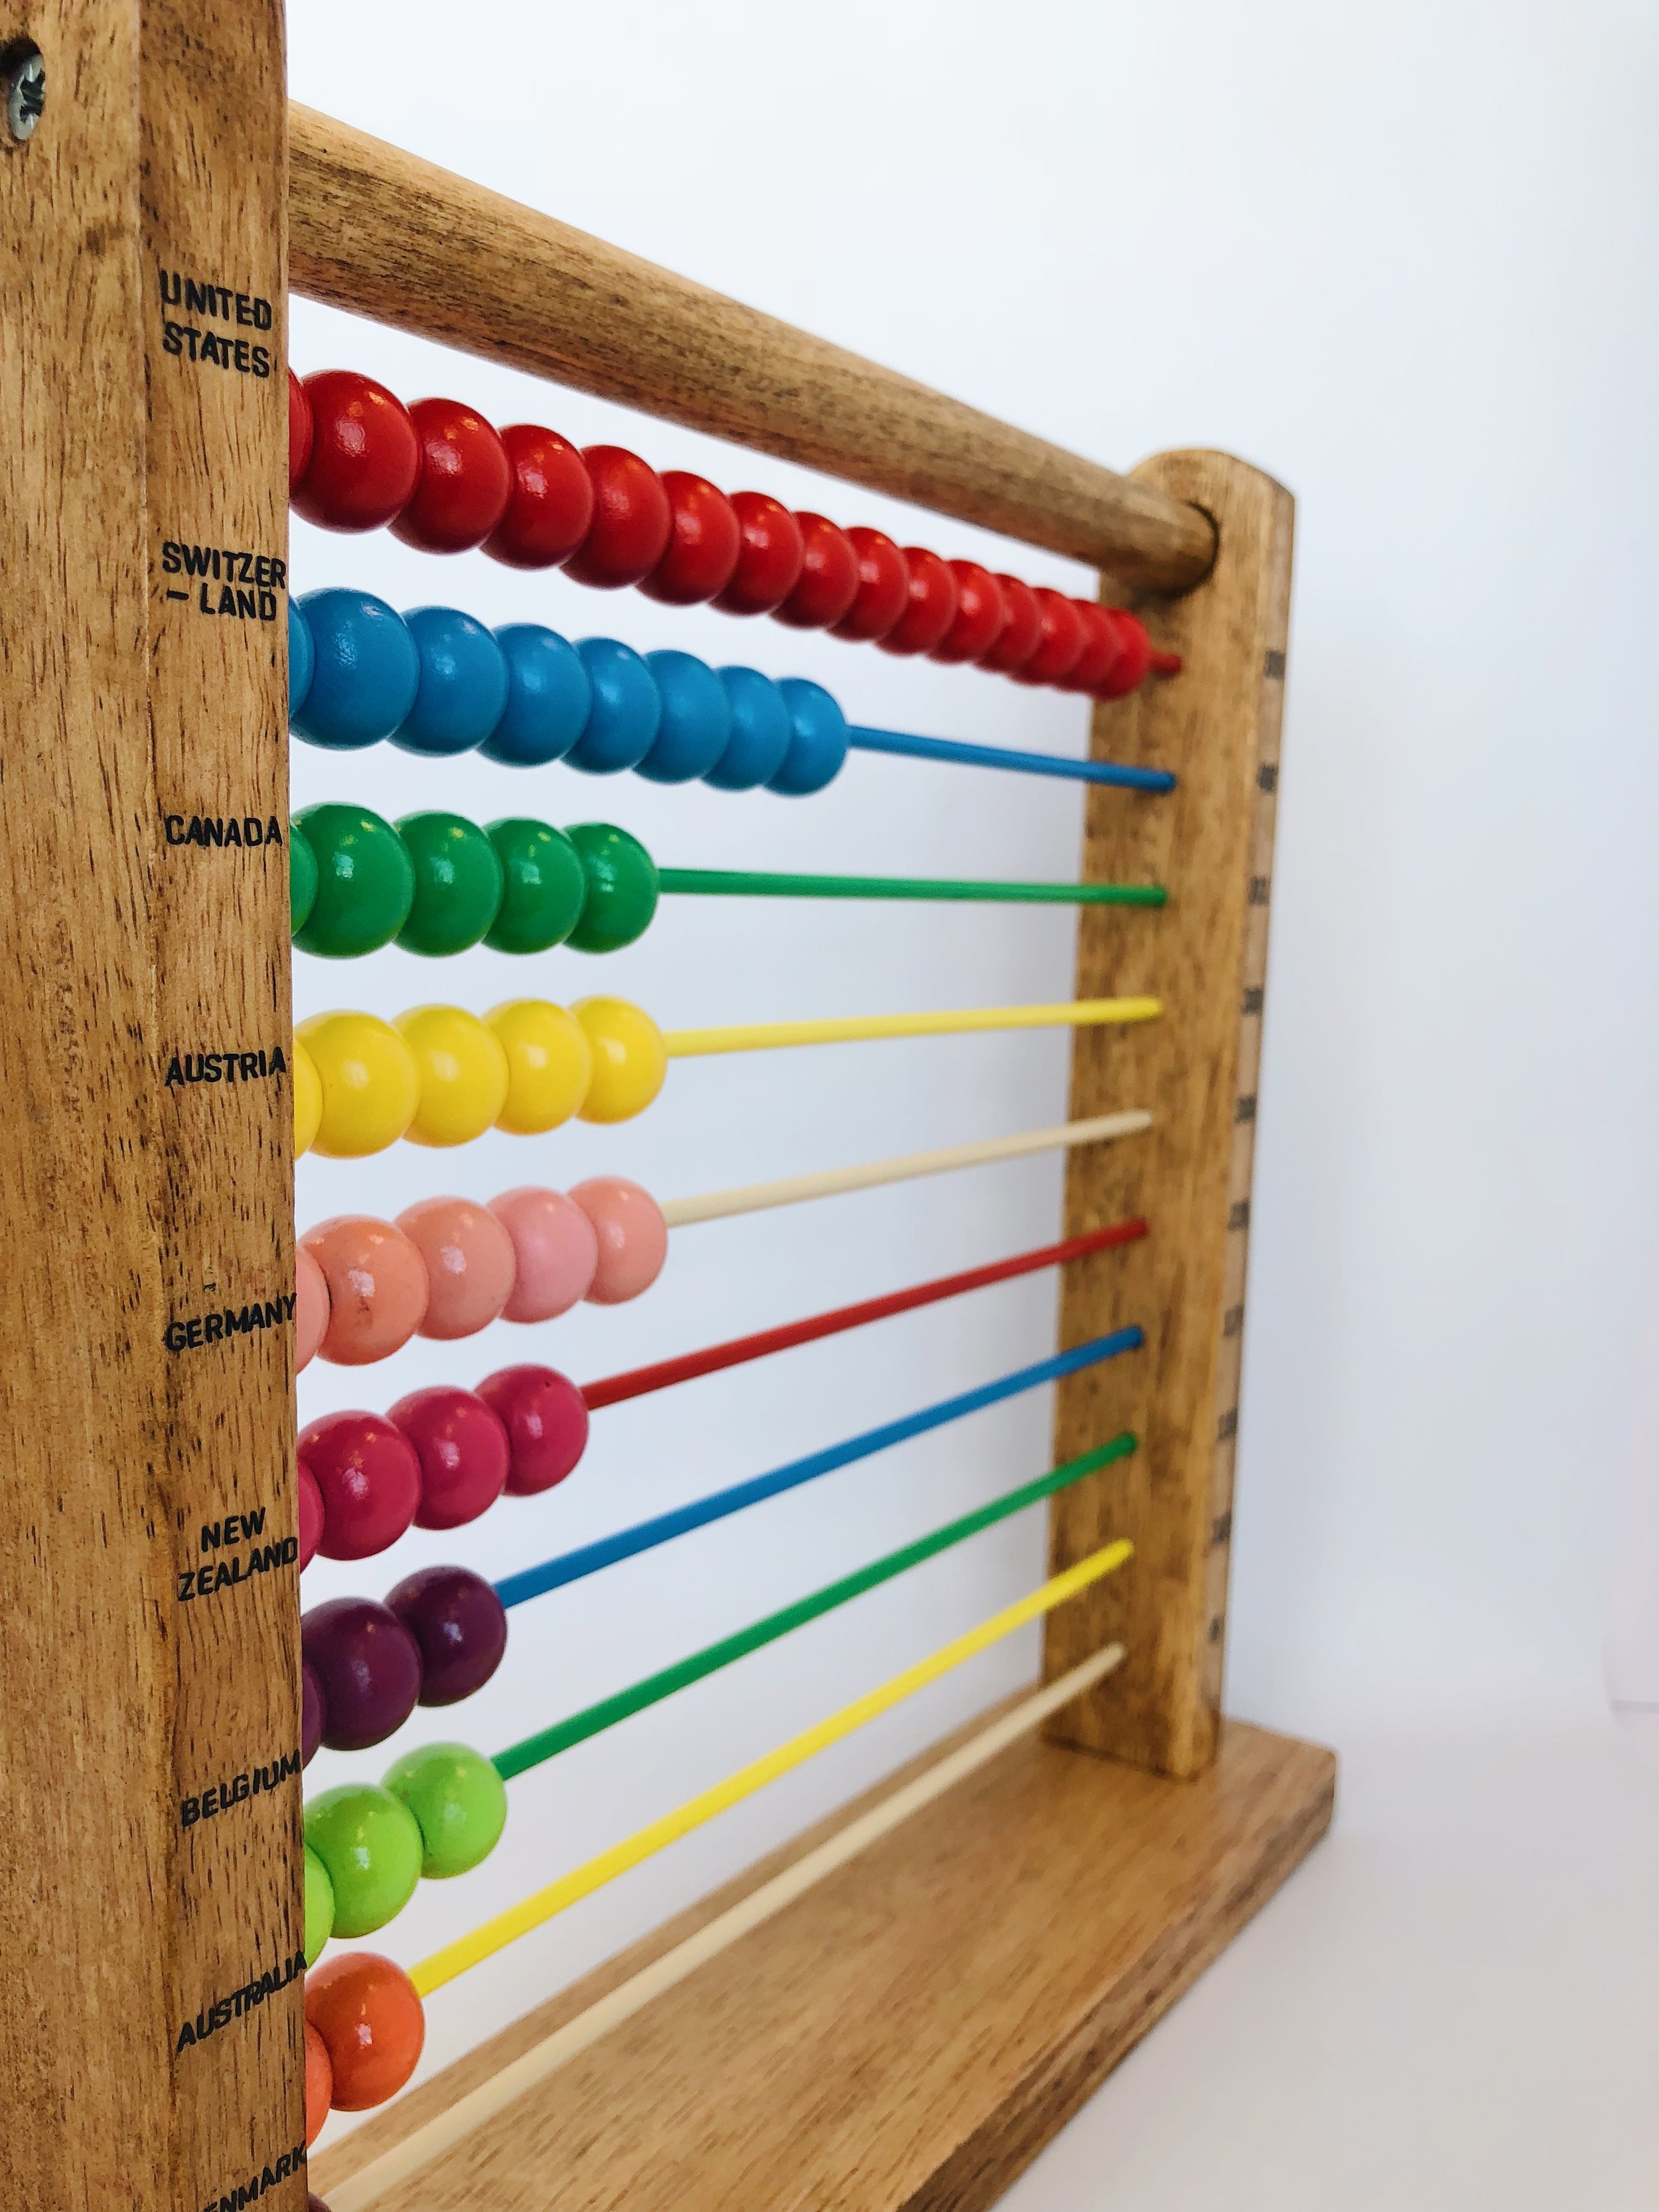
TOY 1
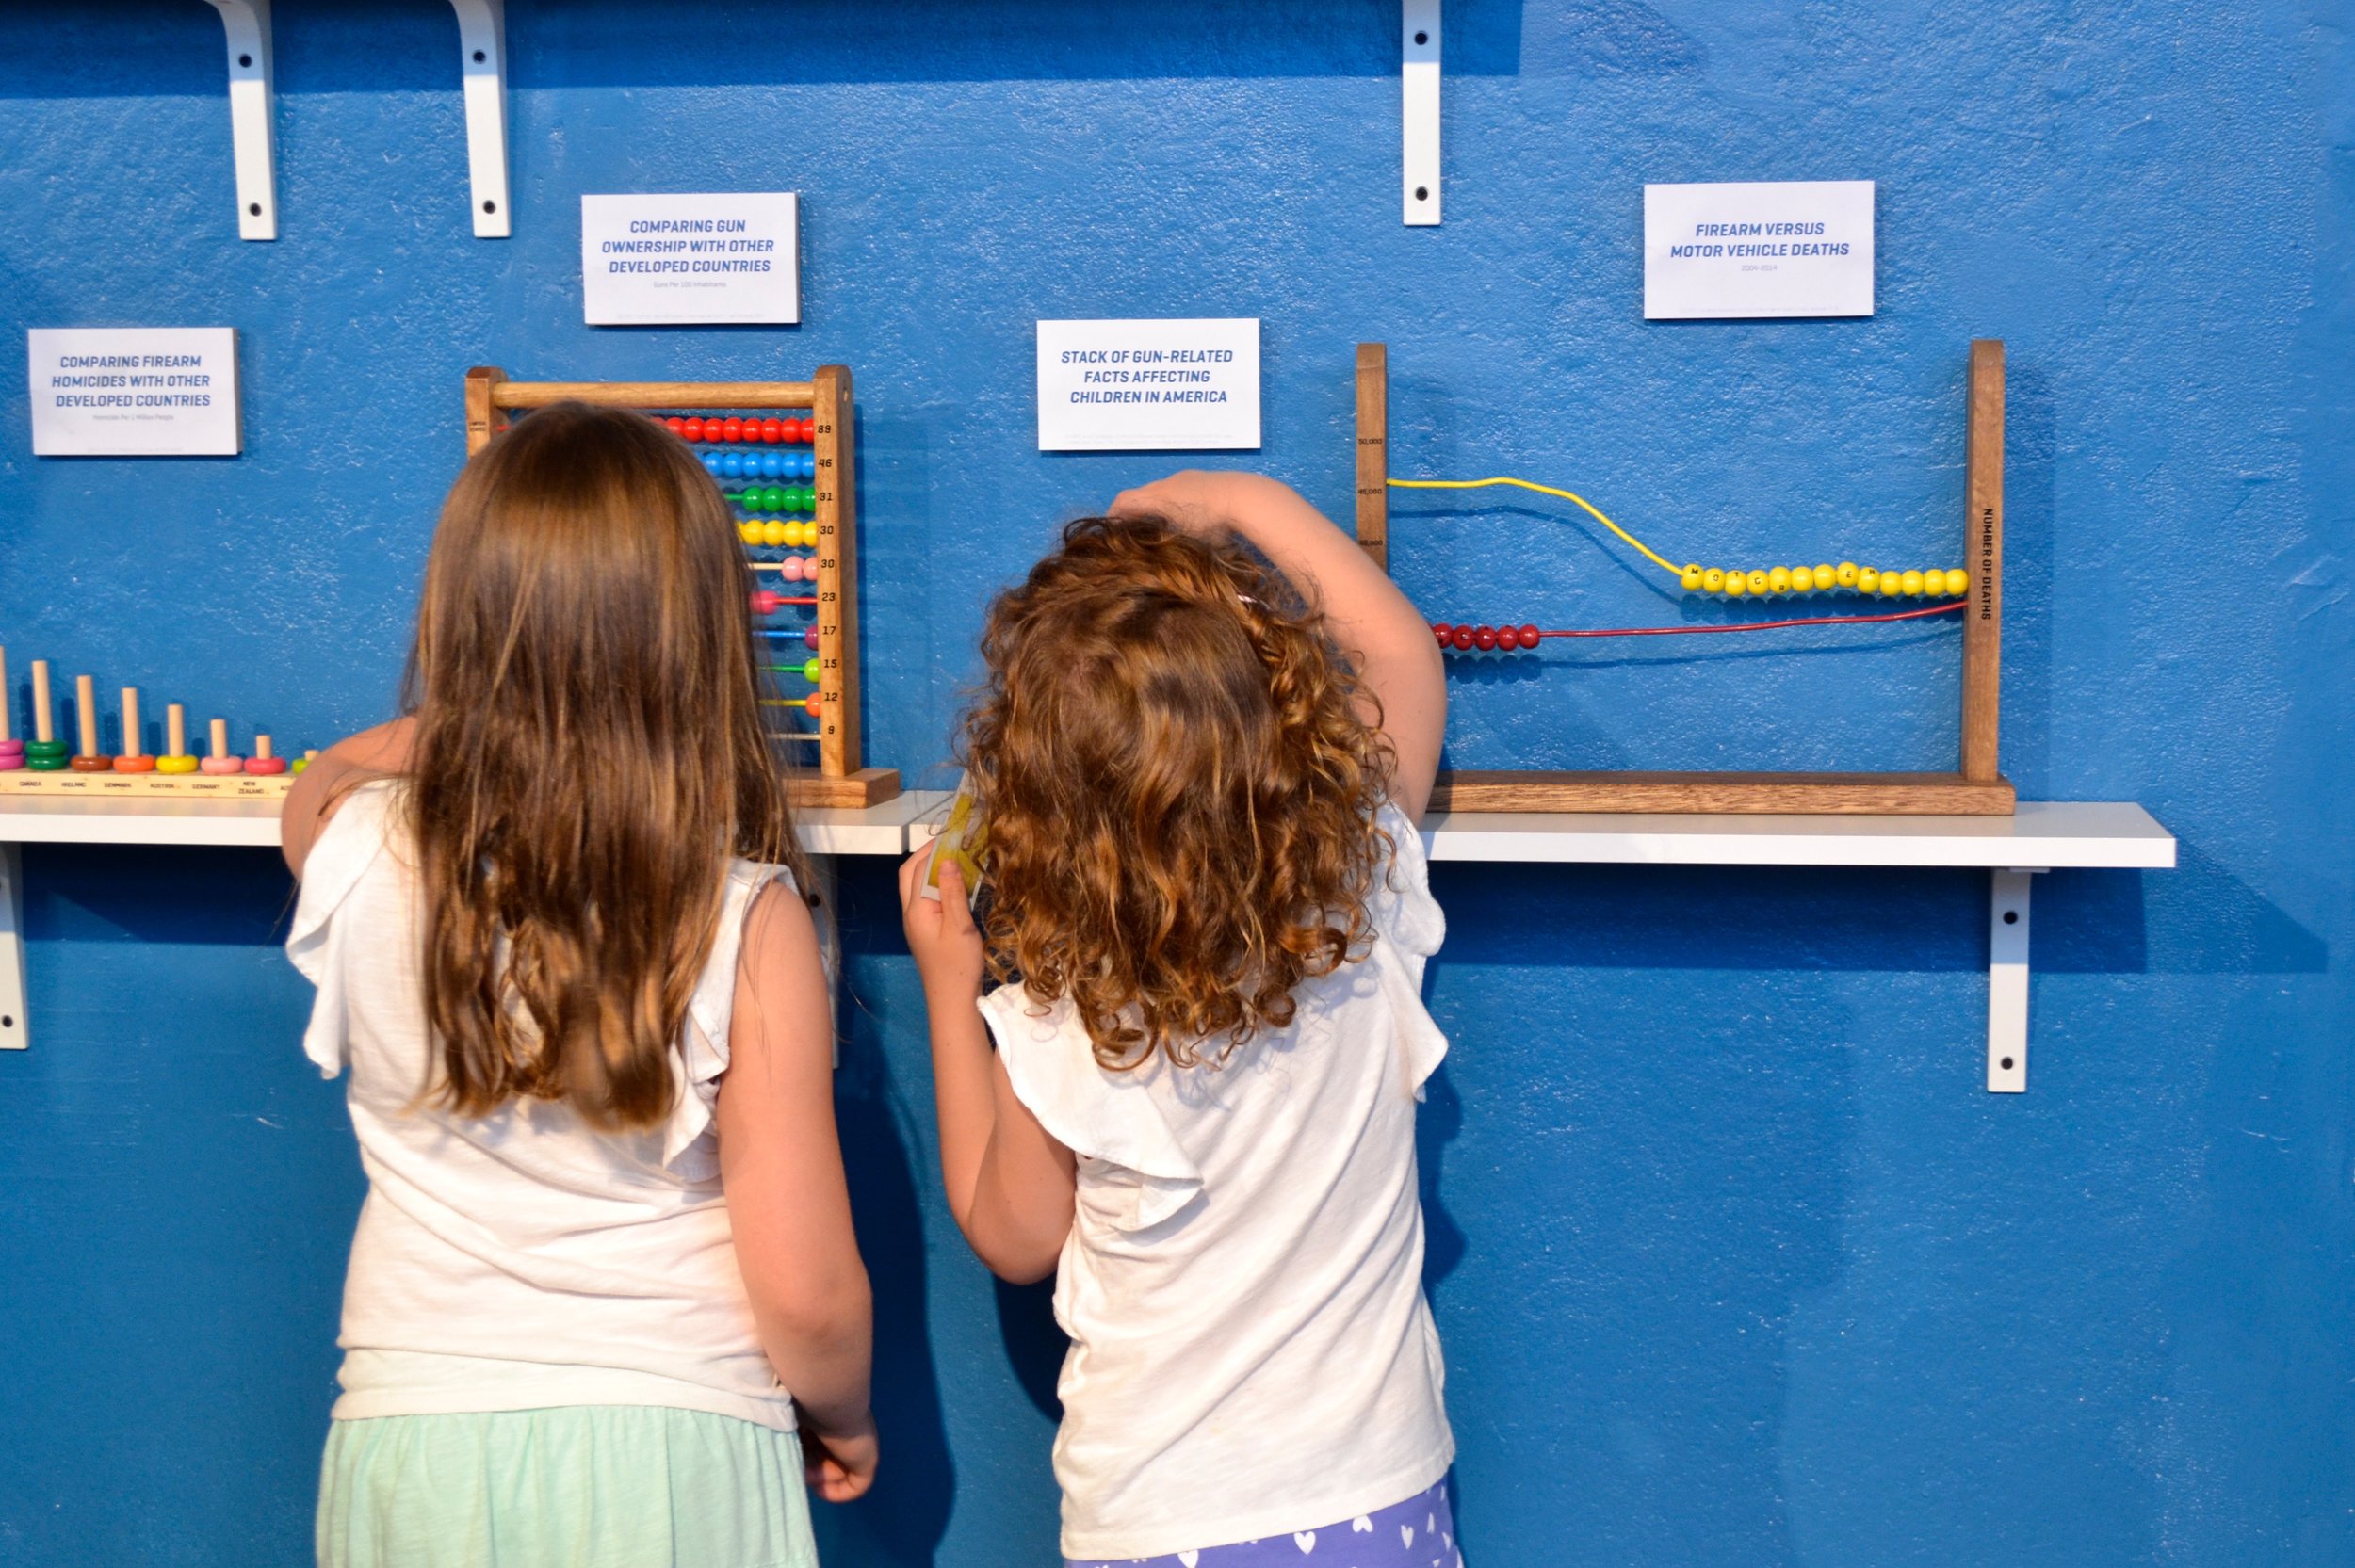
Comparing Gun Ownership with Other Developed Countries (Guns Per 100 Inhabitants)
TOY 2
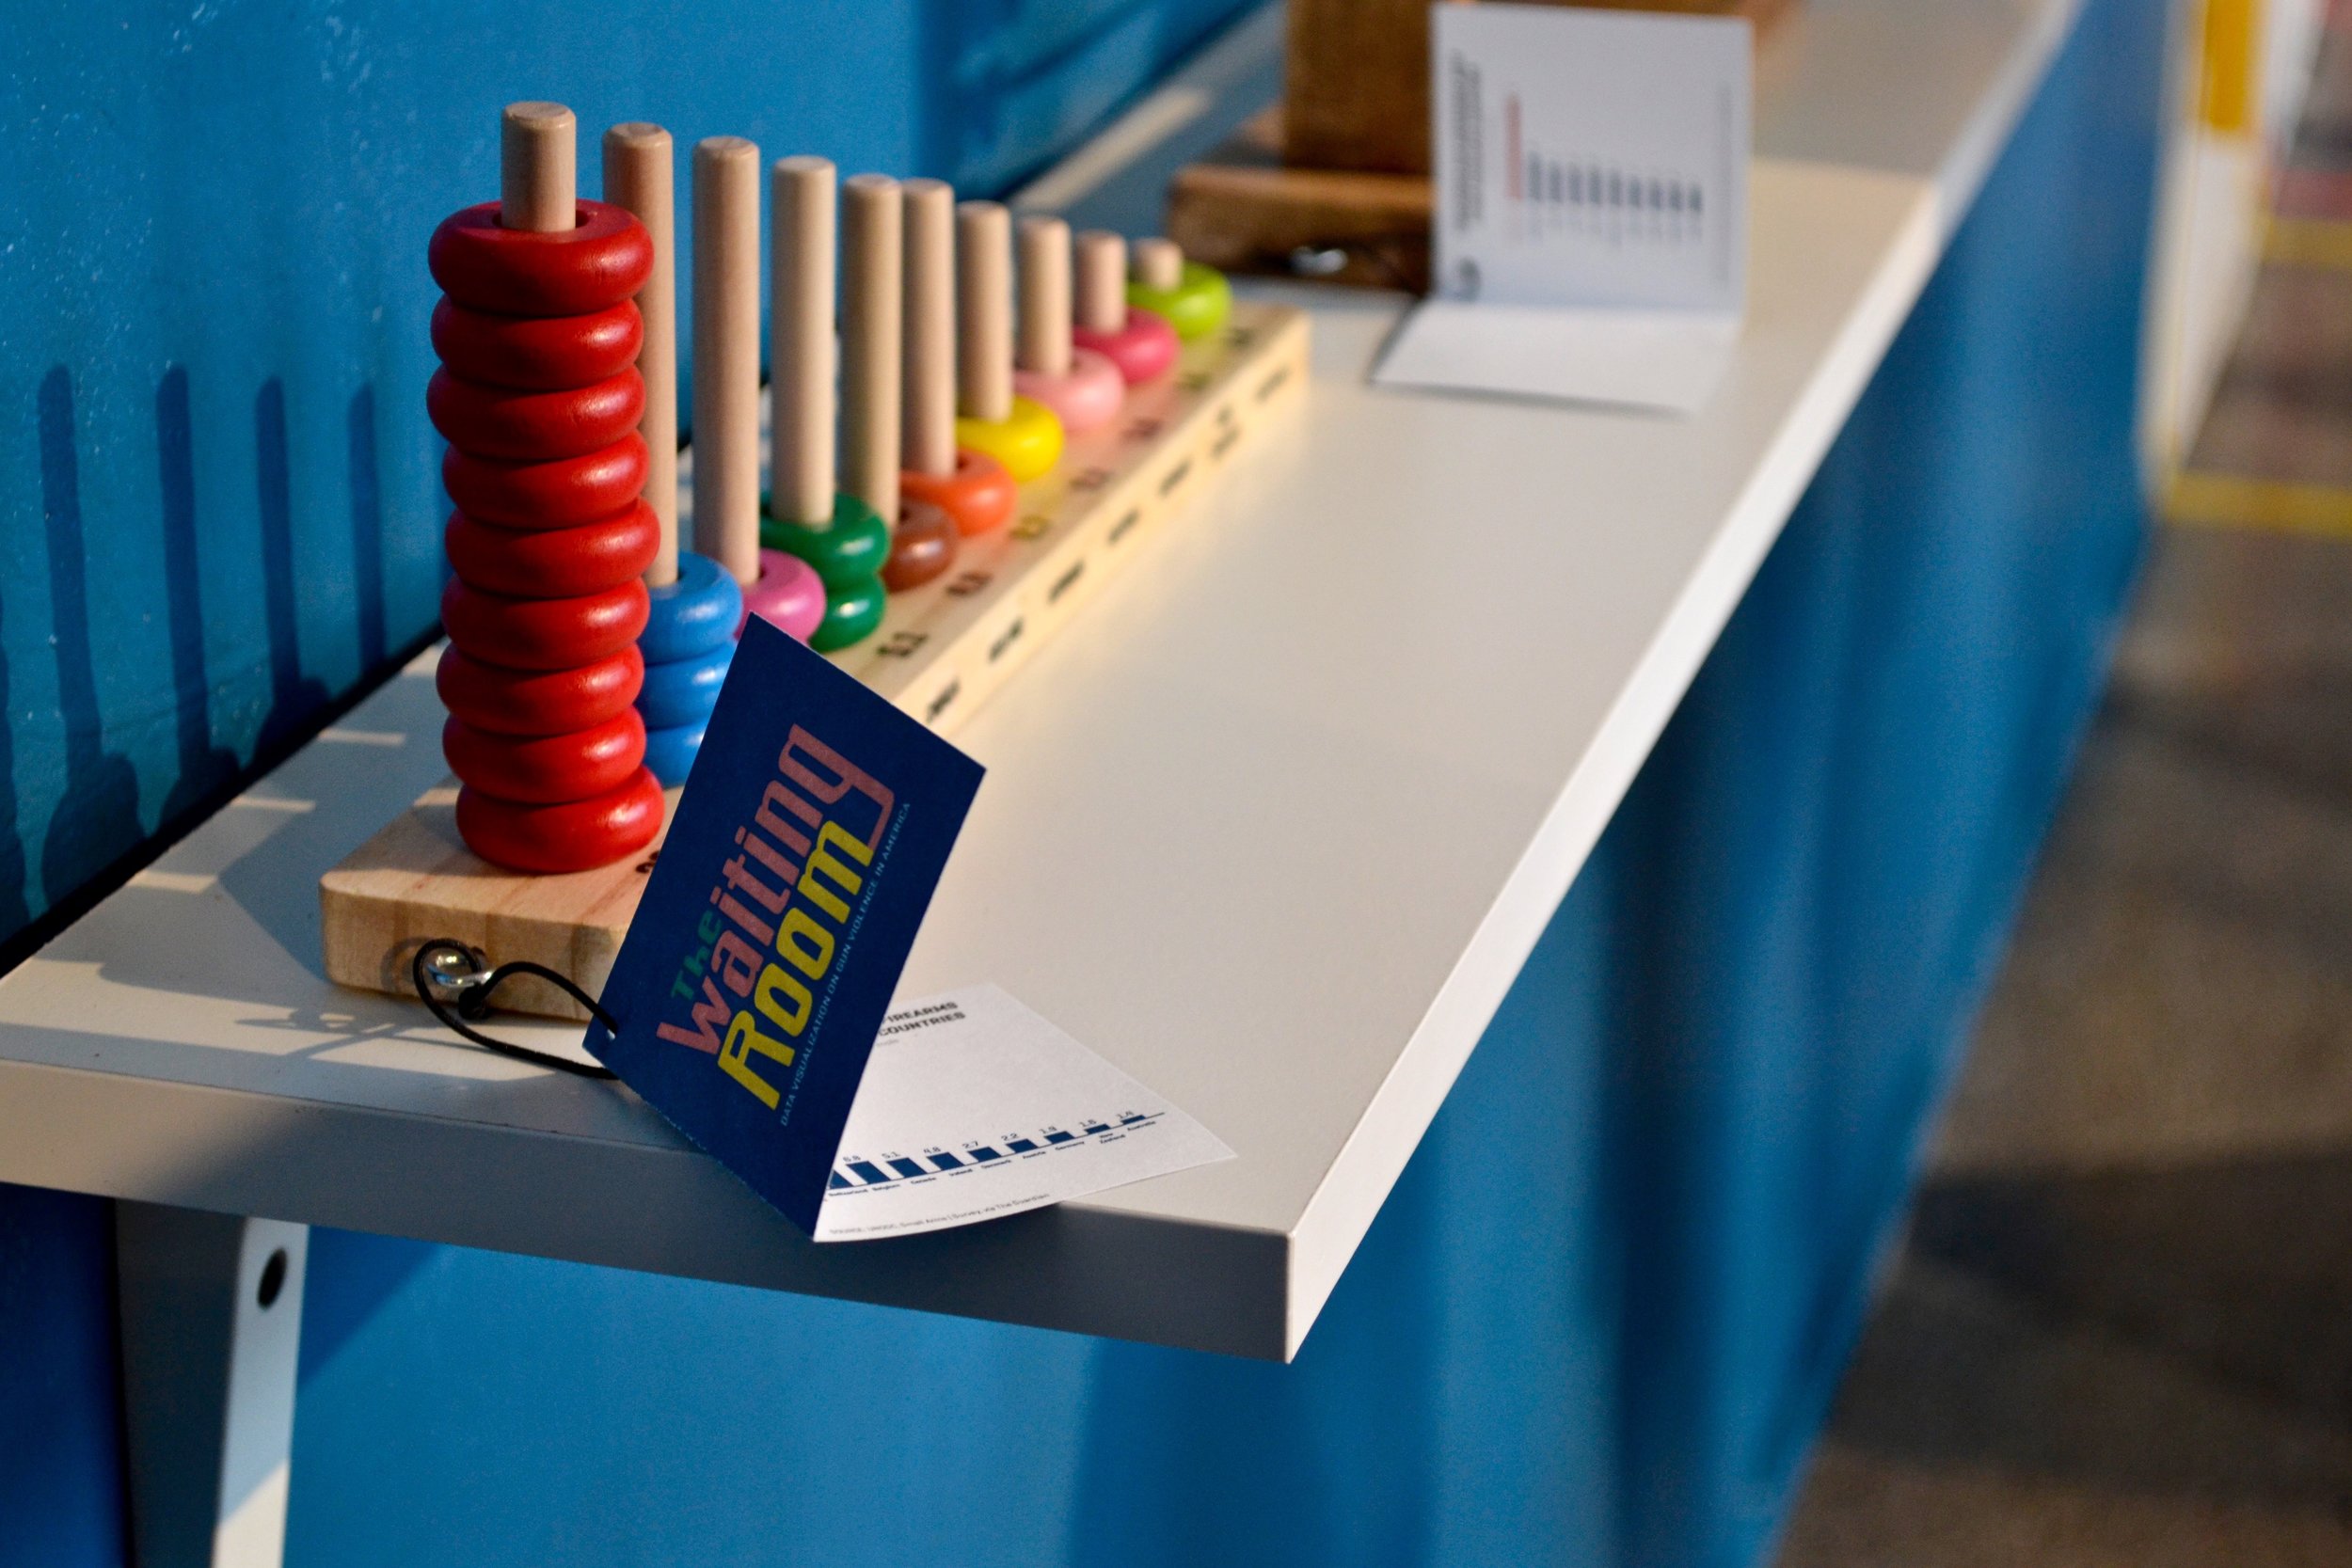
Comparing Firearm Homicide Rate with Other Developed Countries (Per 1 Million People)
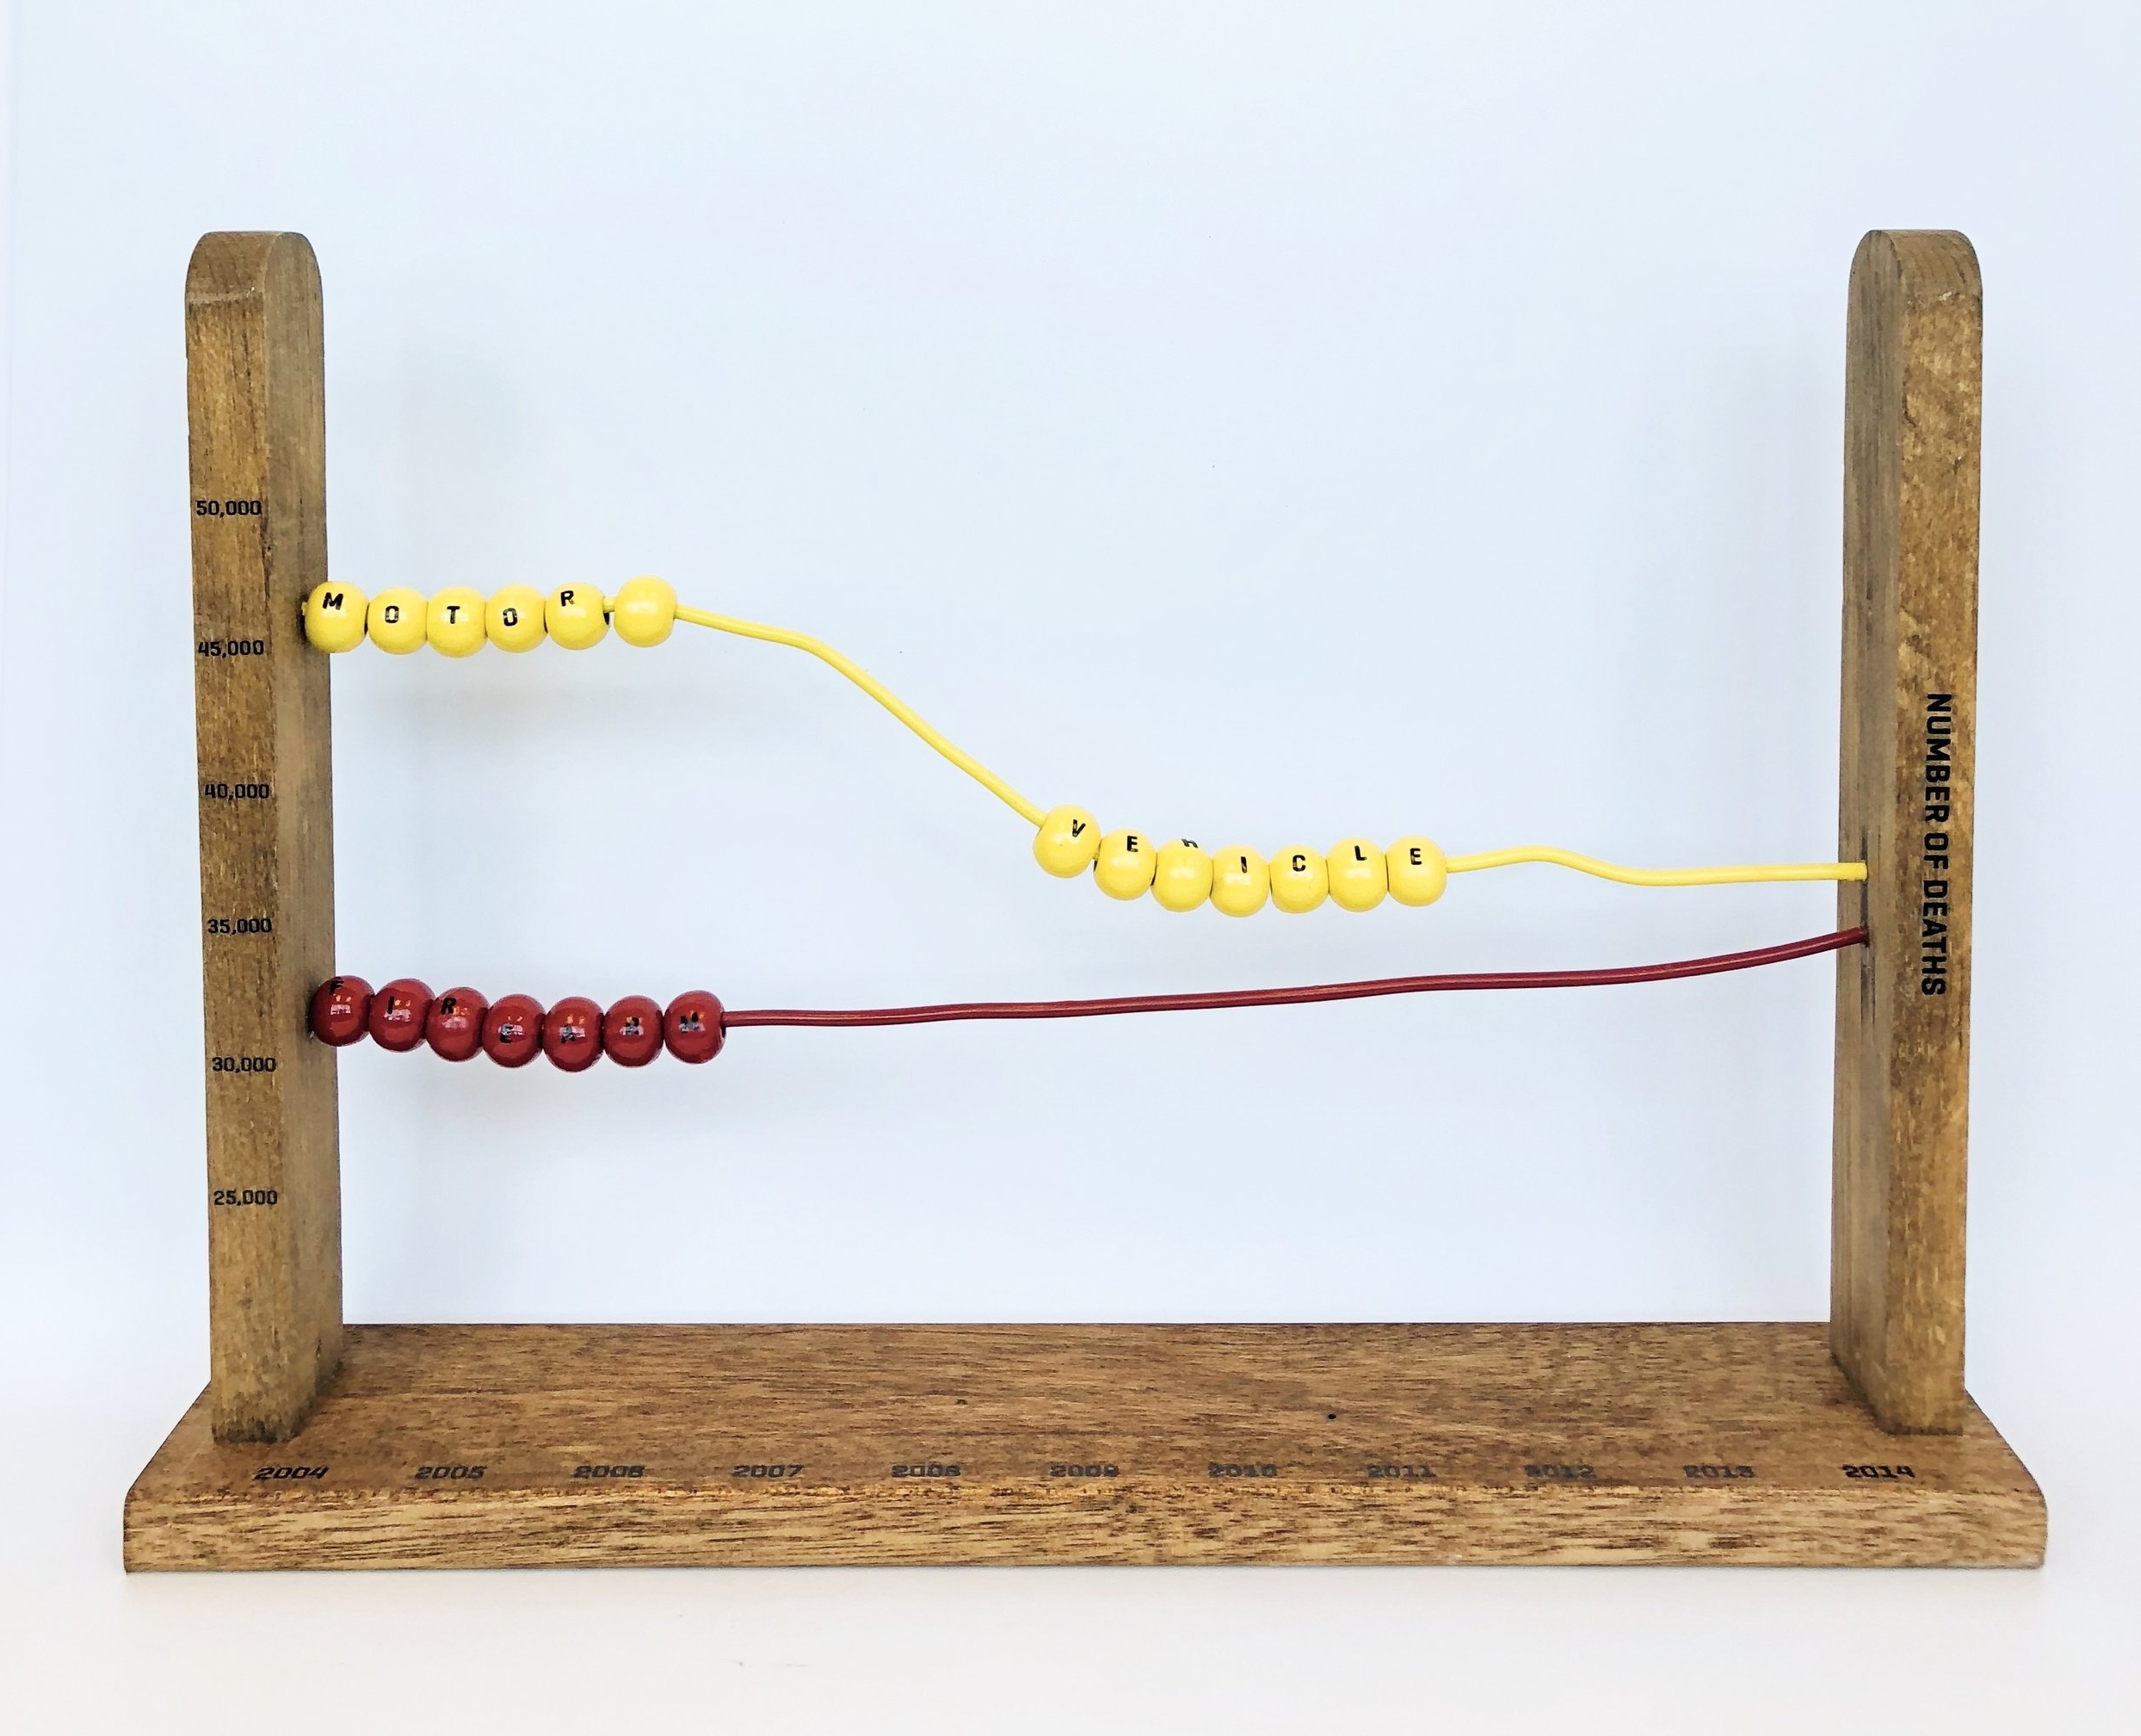
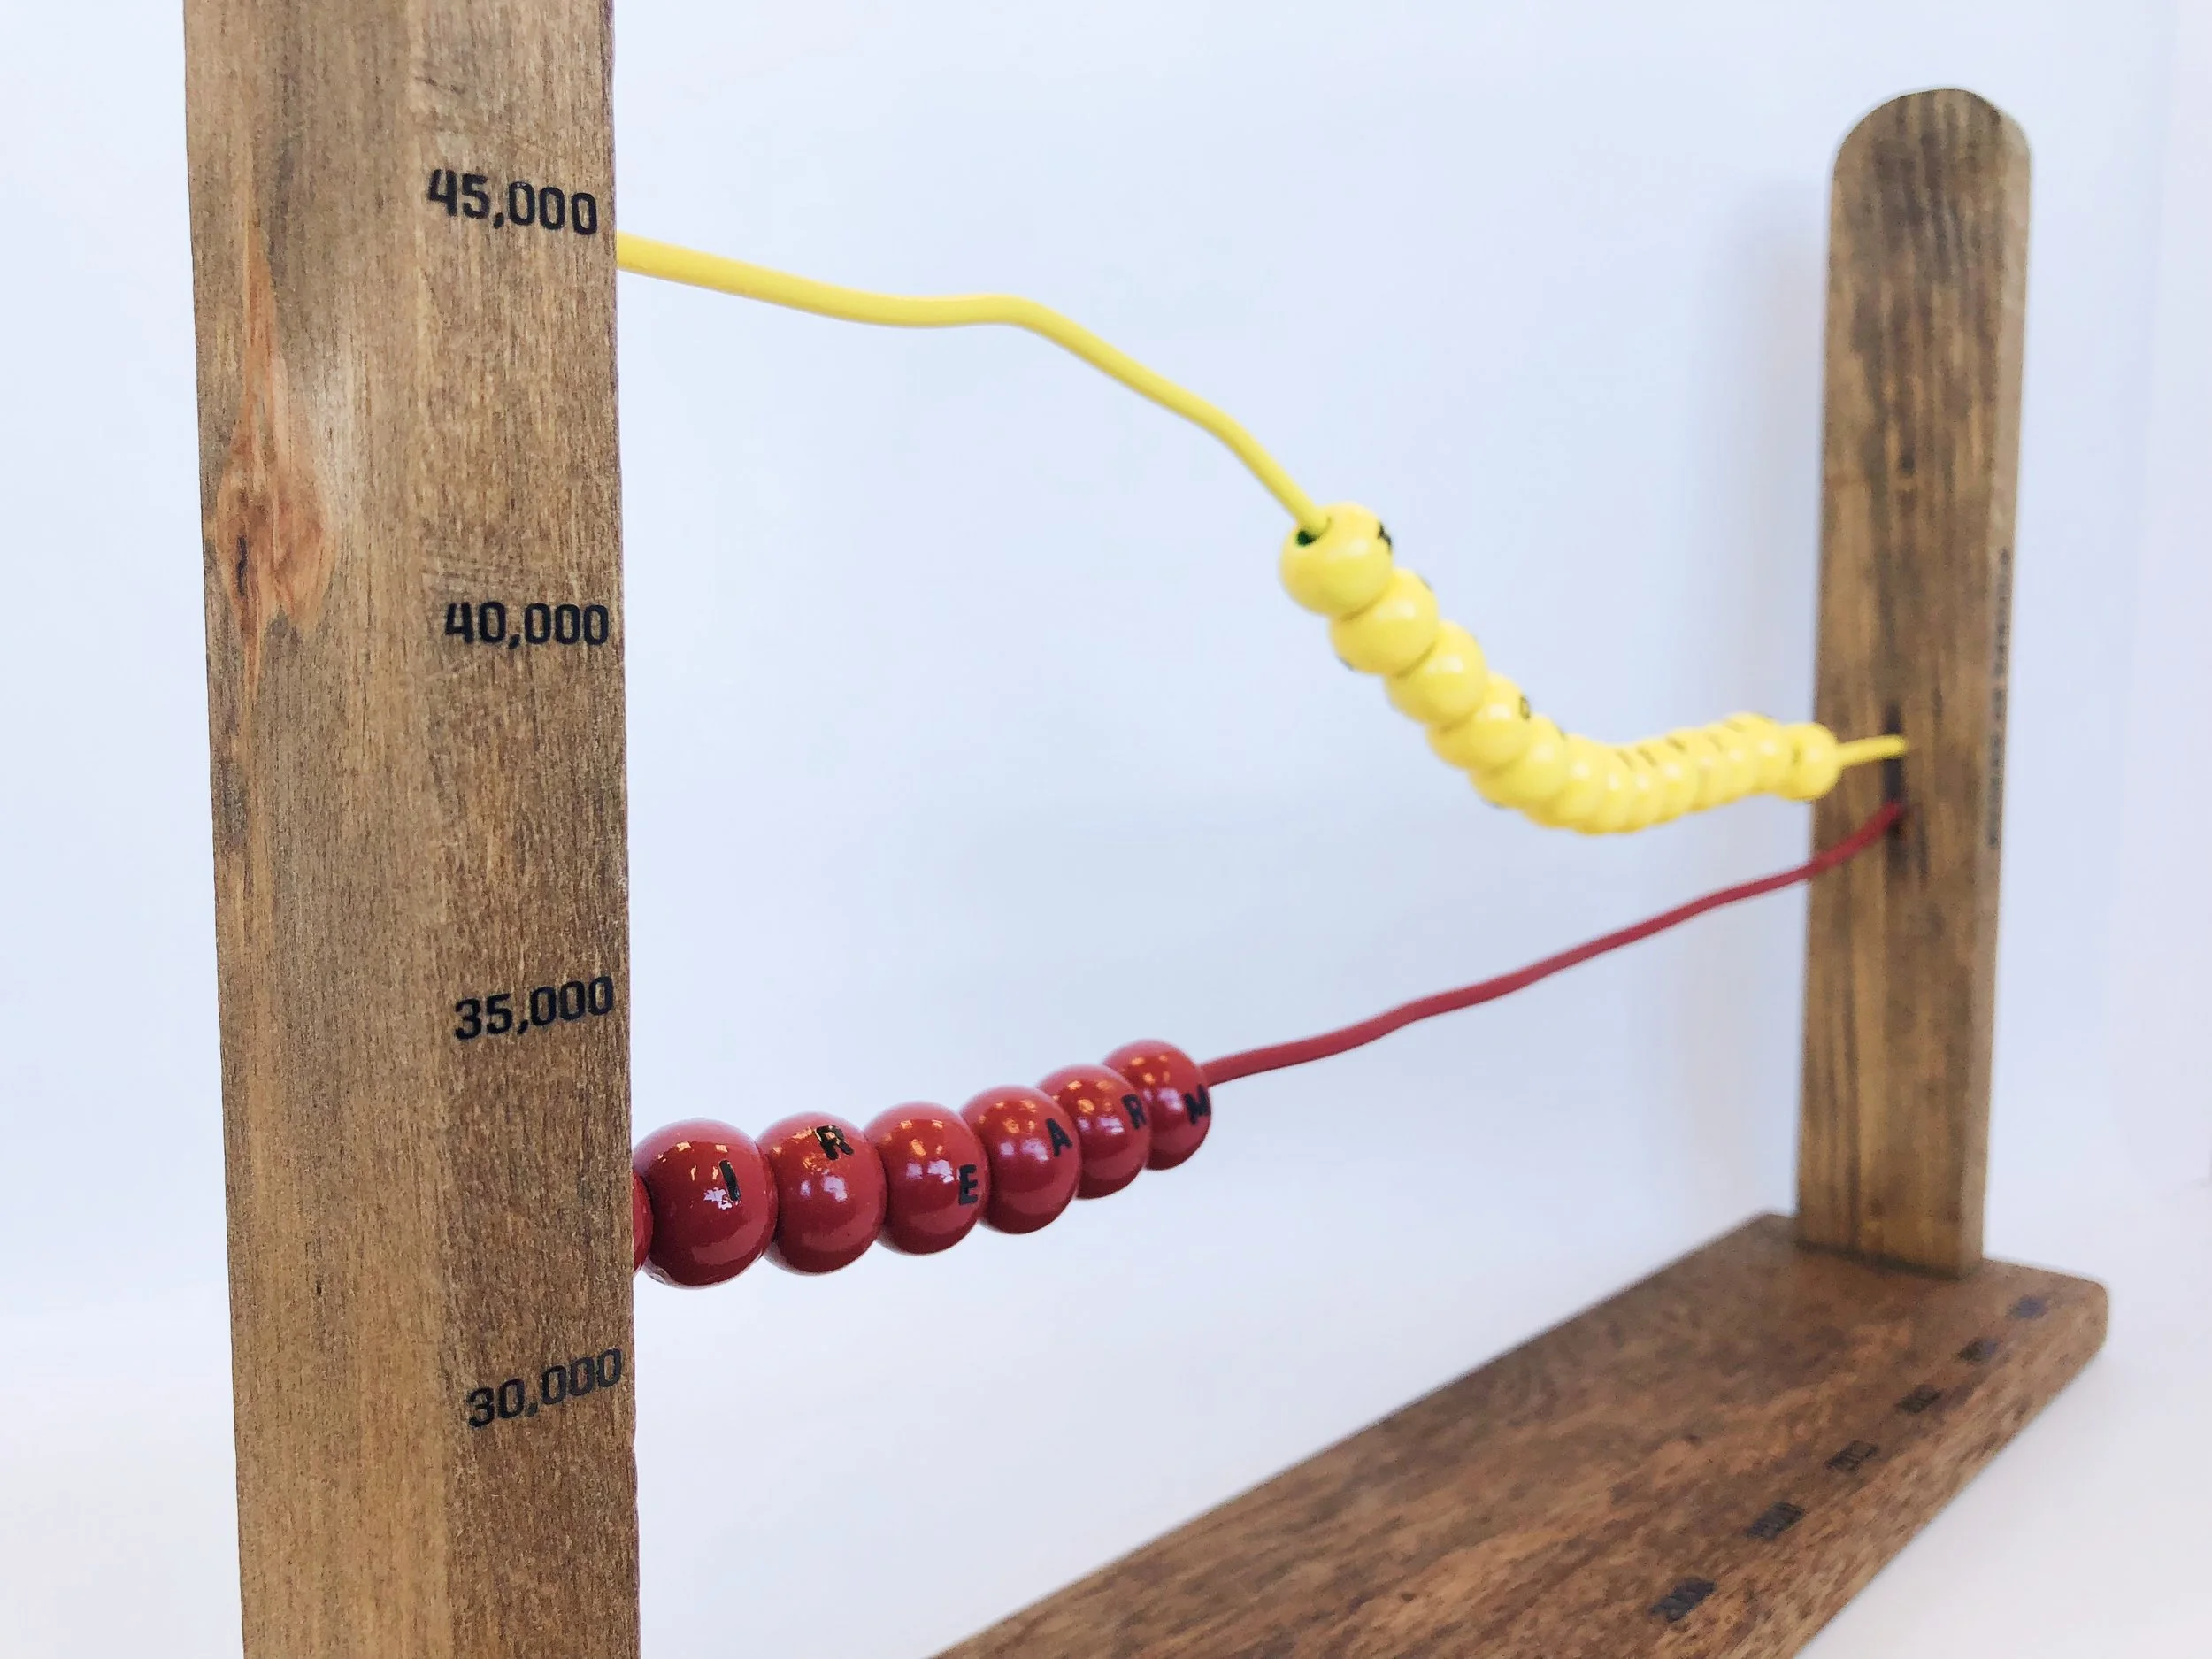
TOY 3
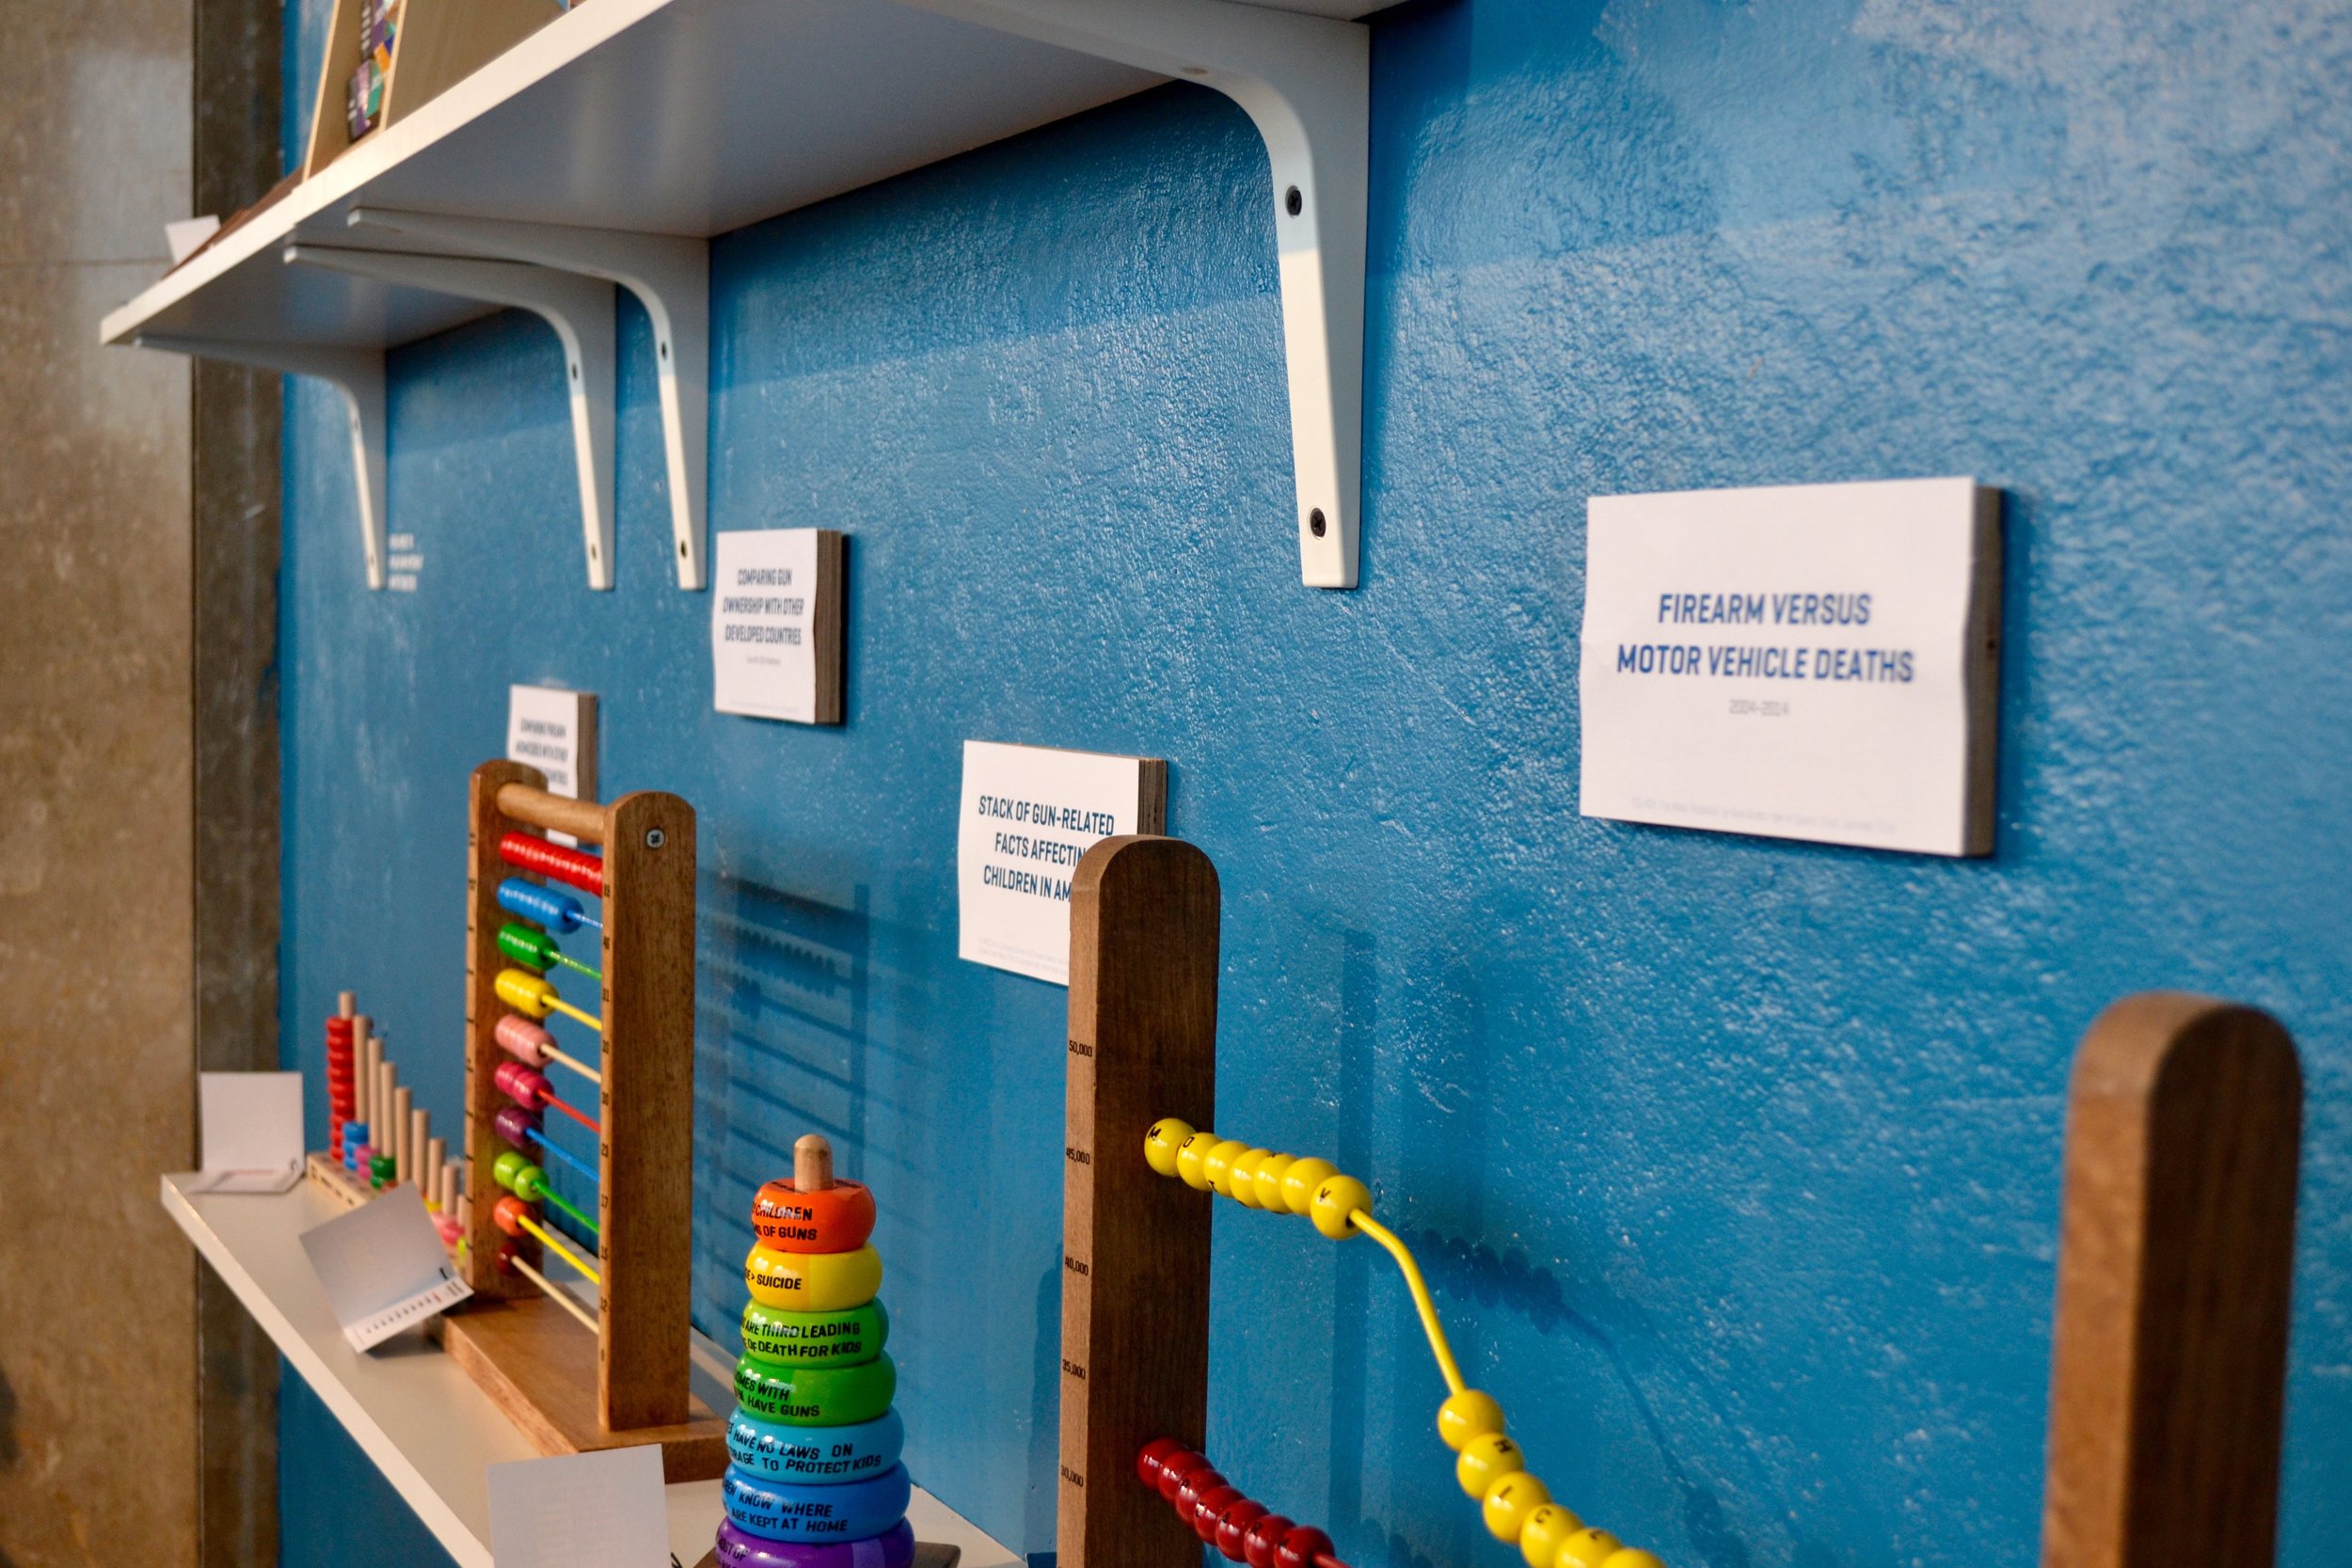
Motor Vehicle vs Firearm Deaths (2004-2014)
TOY 4
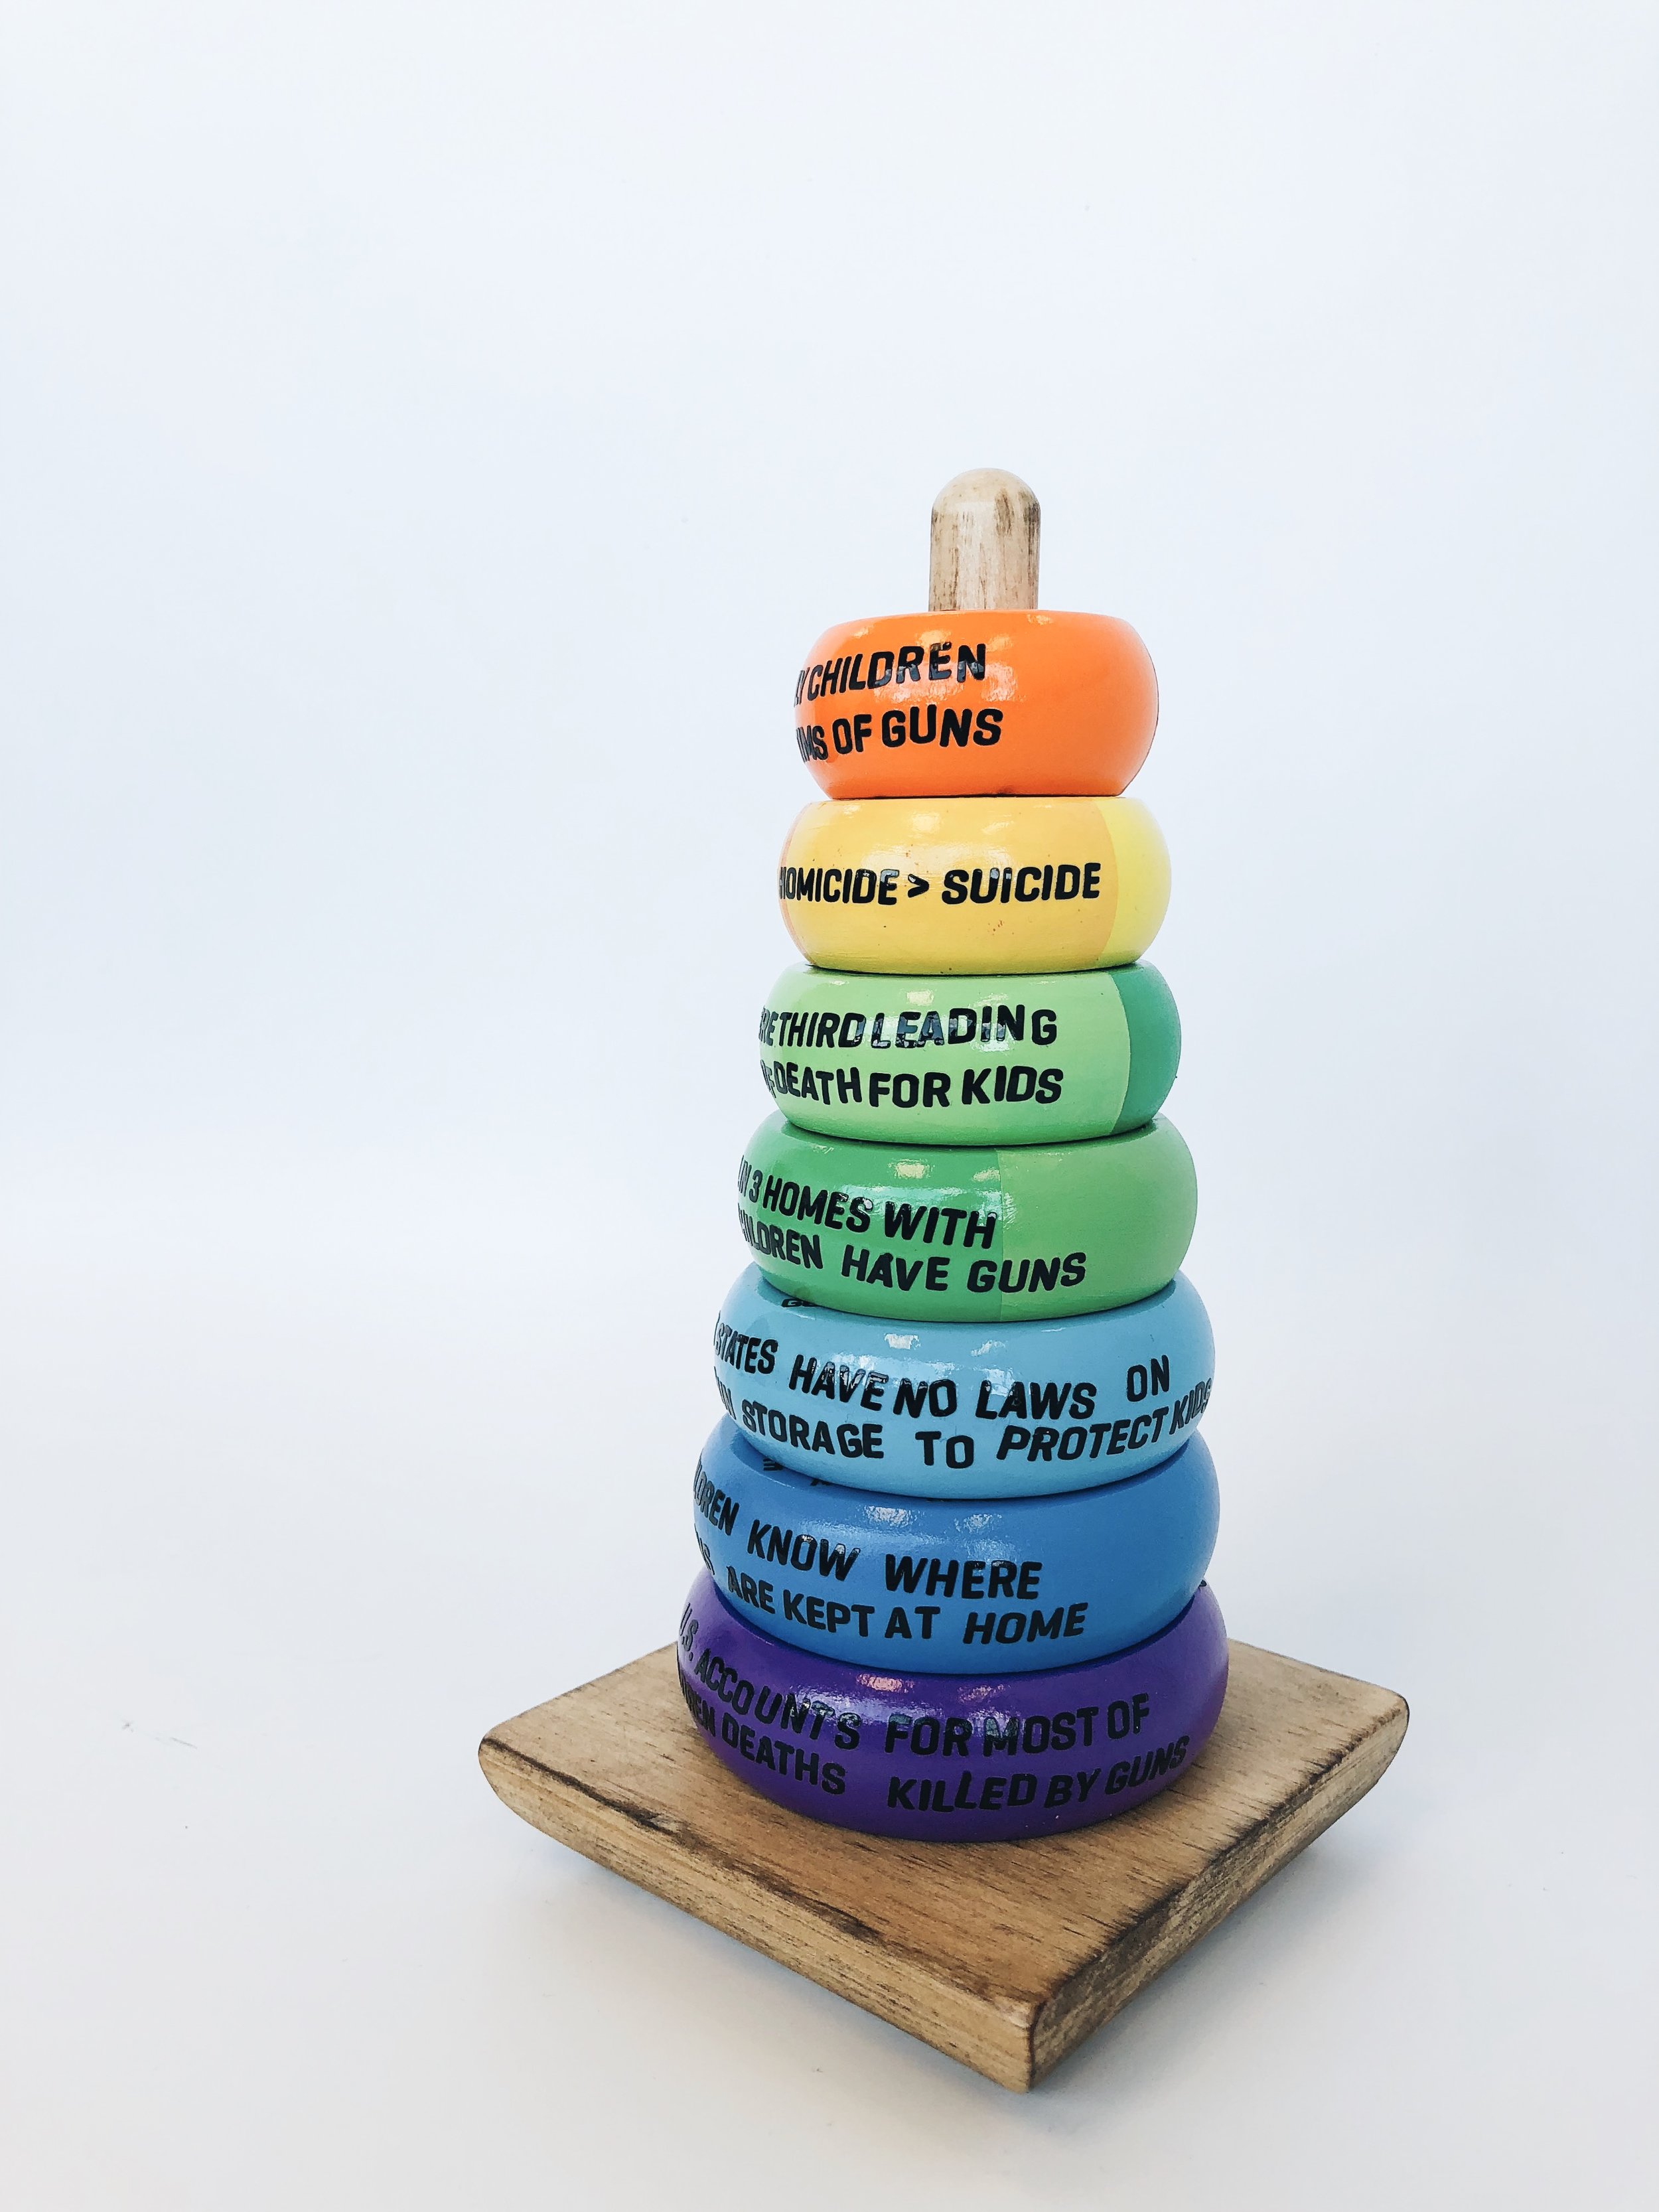
Stack of Facts on the Impact of Gun Violence on American Children
TOY 5
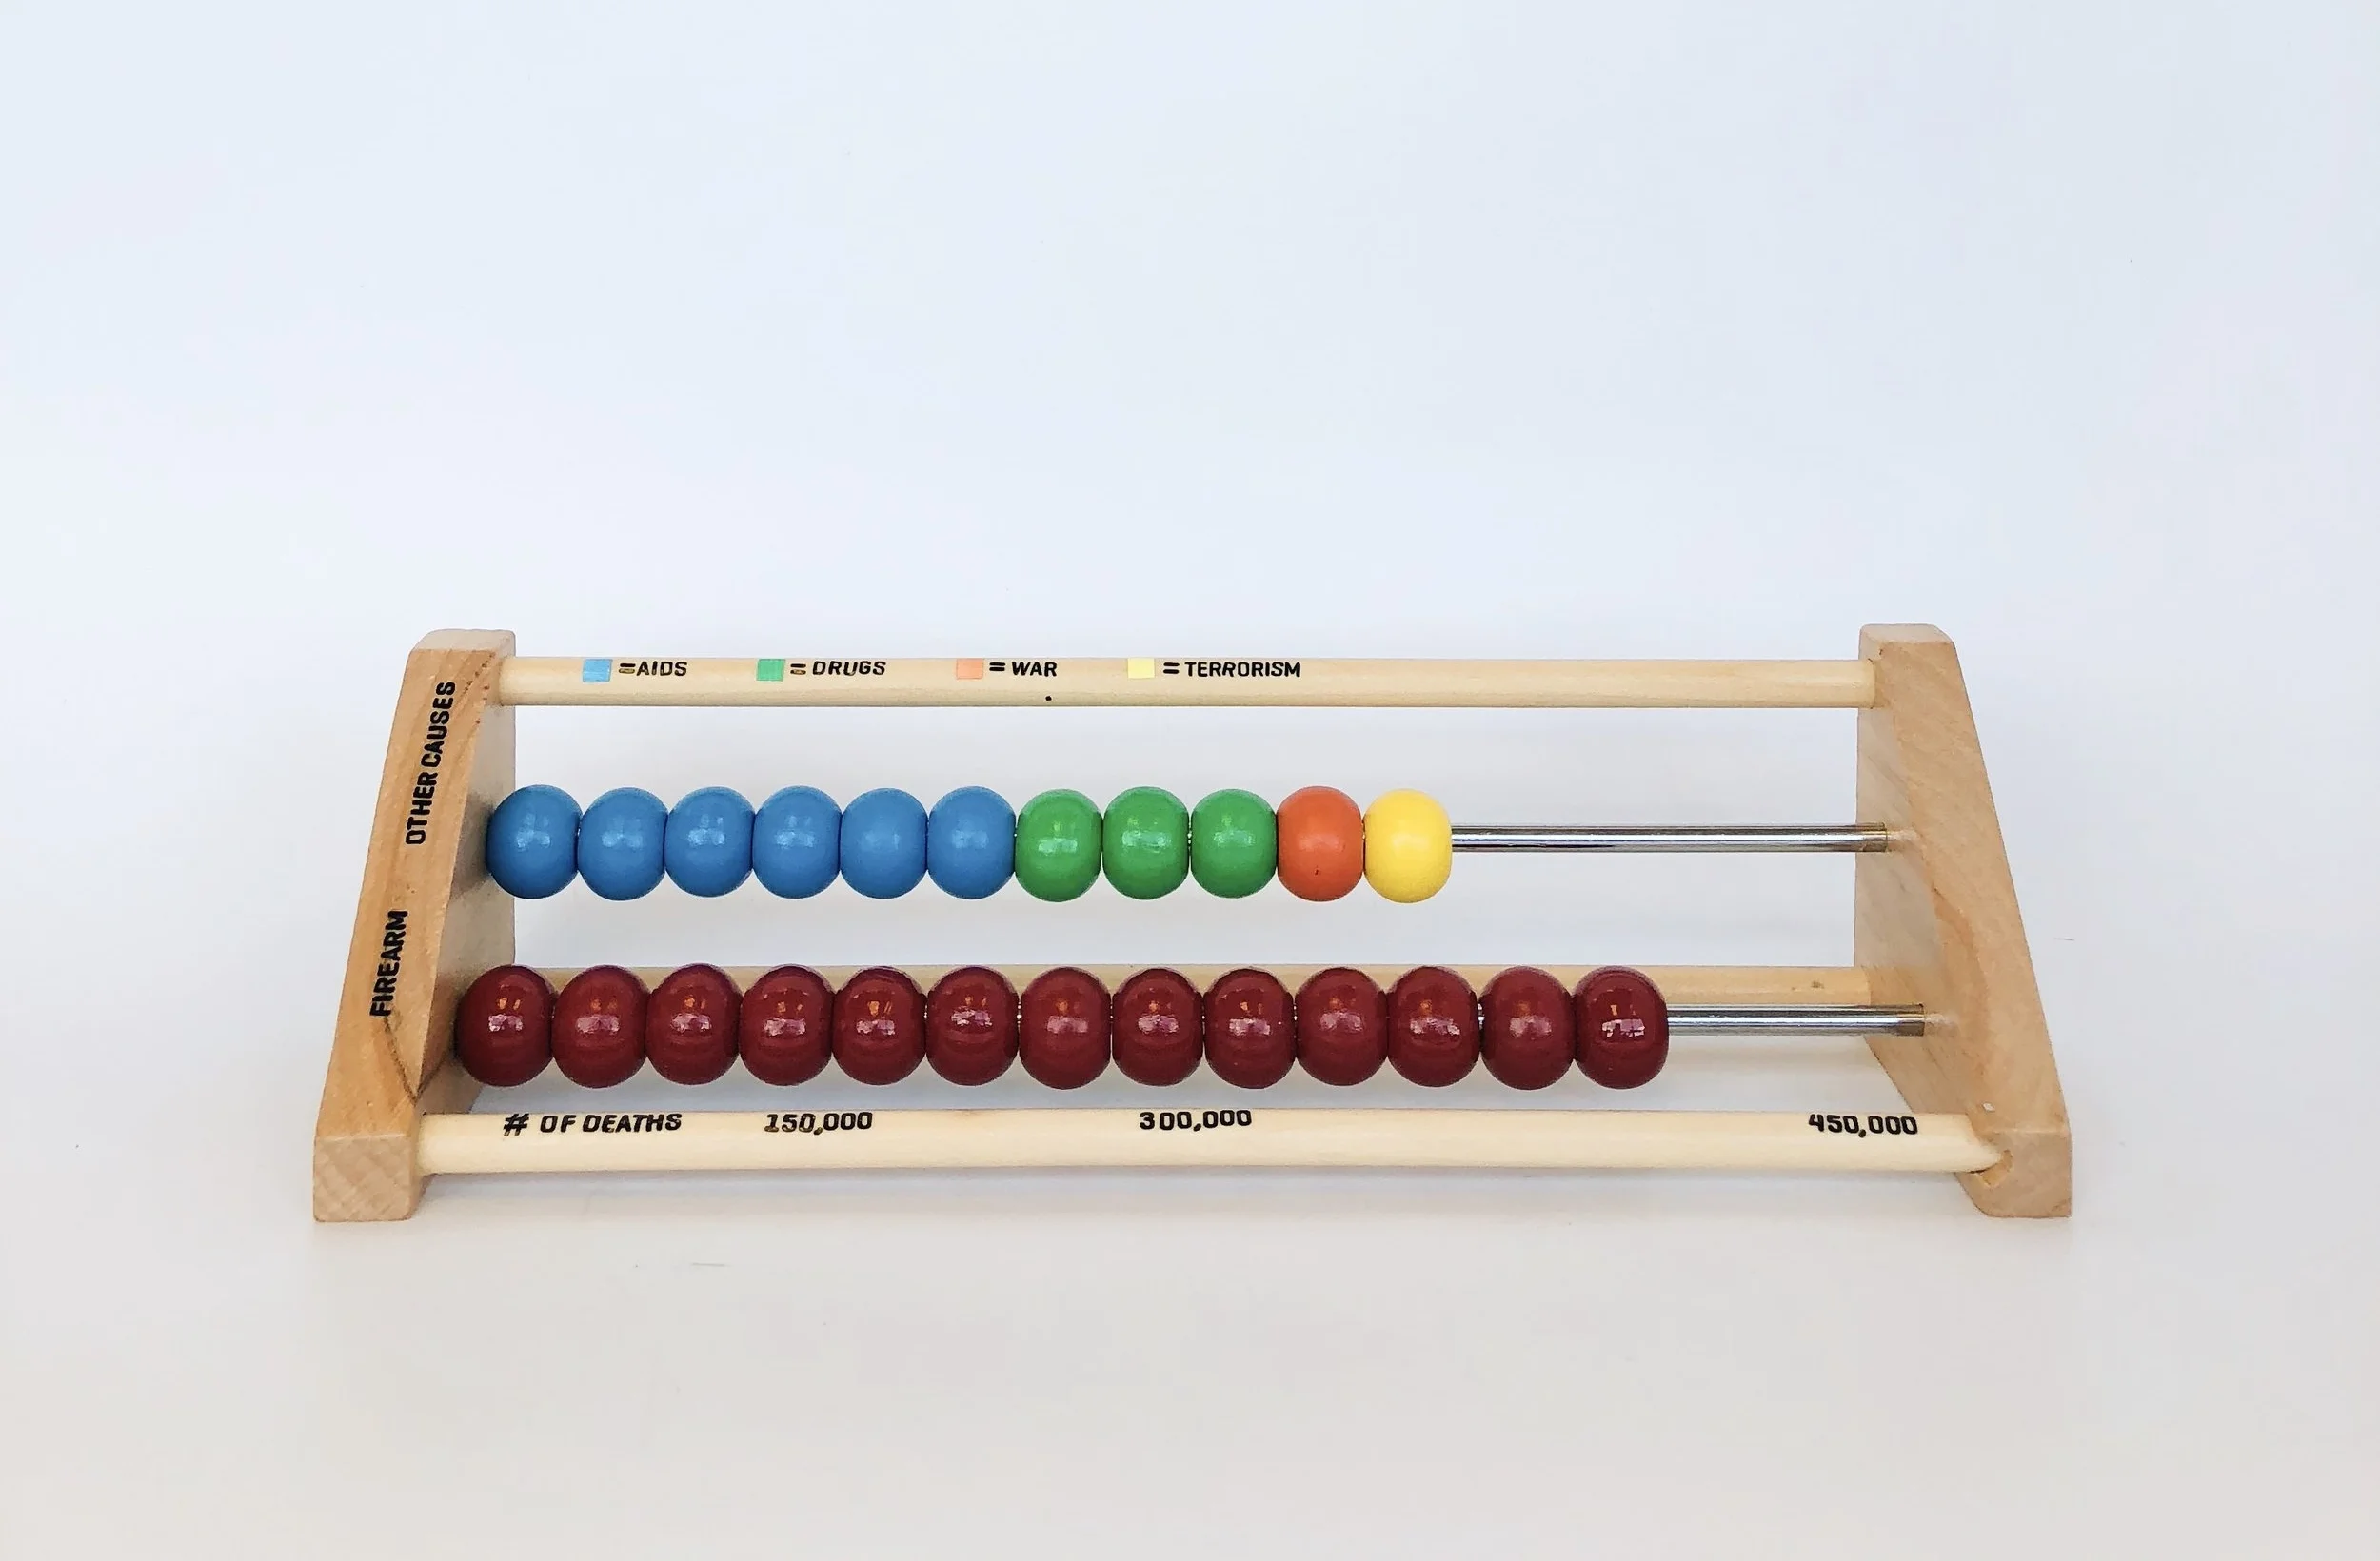
Firearm Deaths Outnumbered Deaths by Aids, Drugs, War and Terrorism
TOY 6
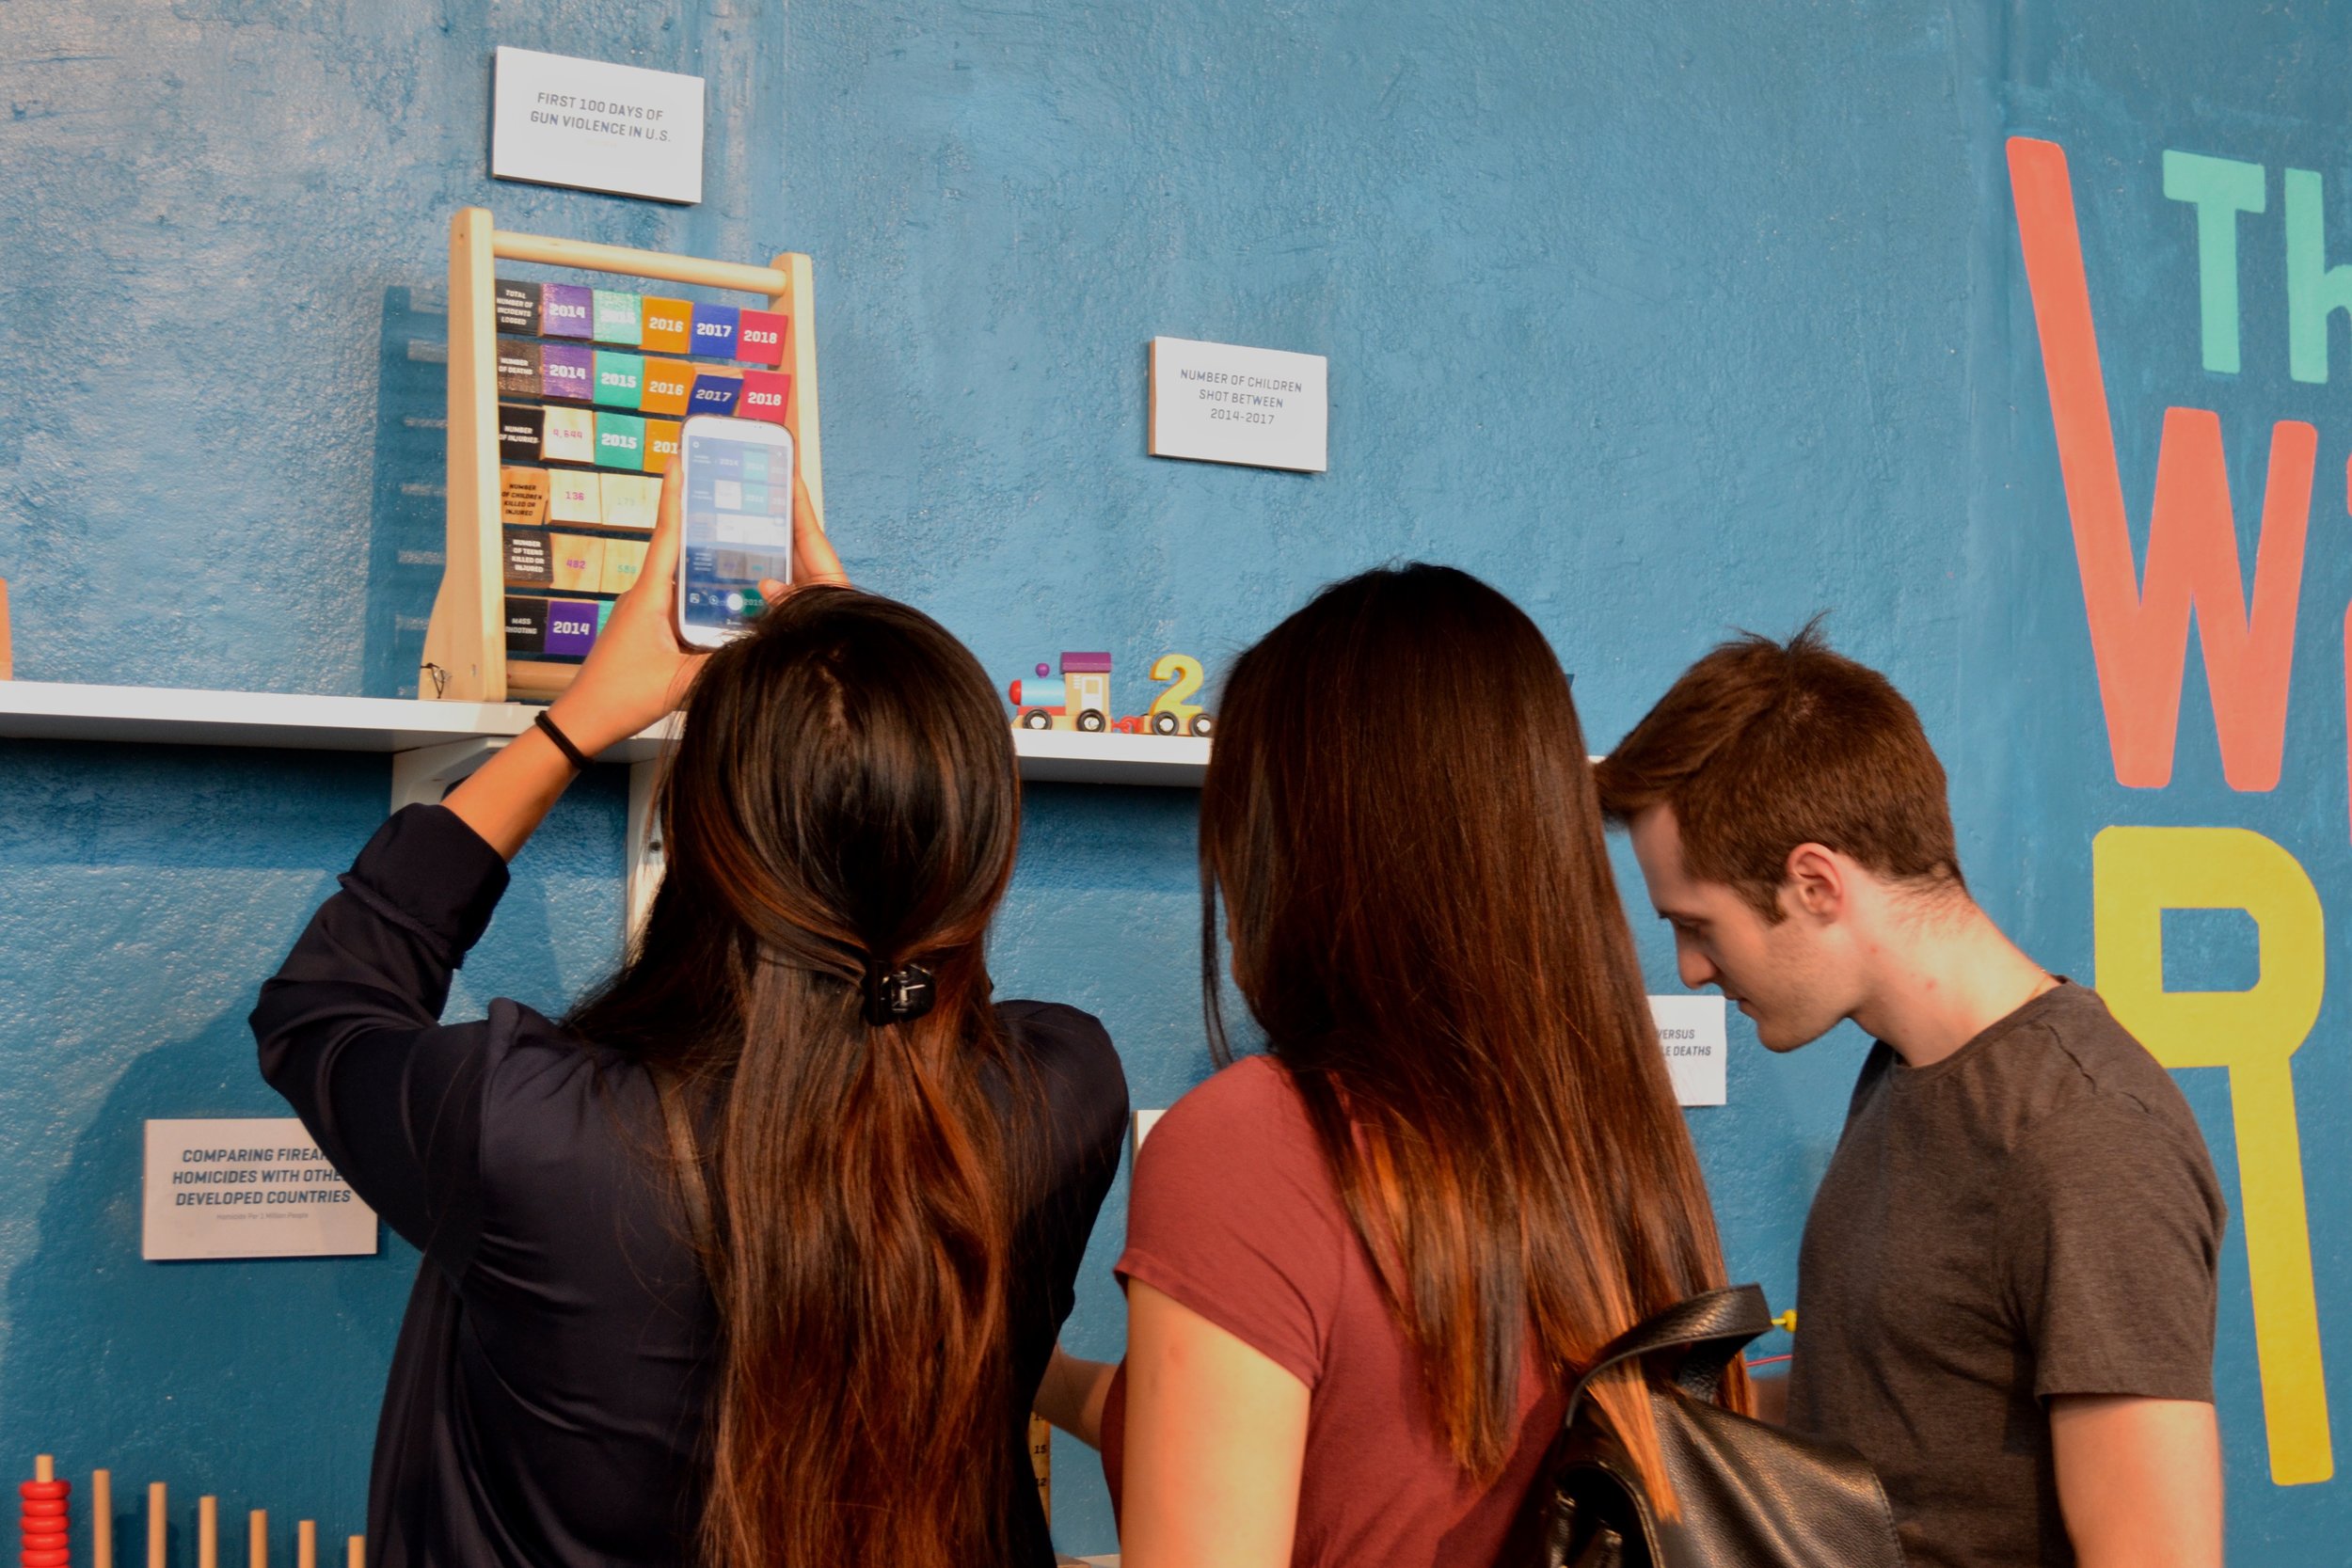
First 100 Days of Gun Violence in the U.S. (2014-2018)
TOY 7
Number of Children Shot Between 2014-2017
CHAIRS
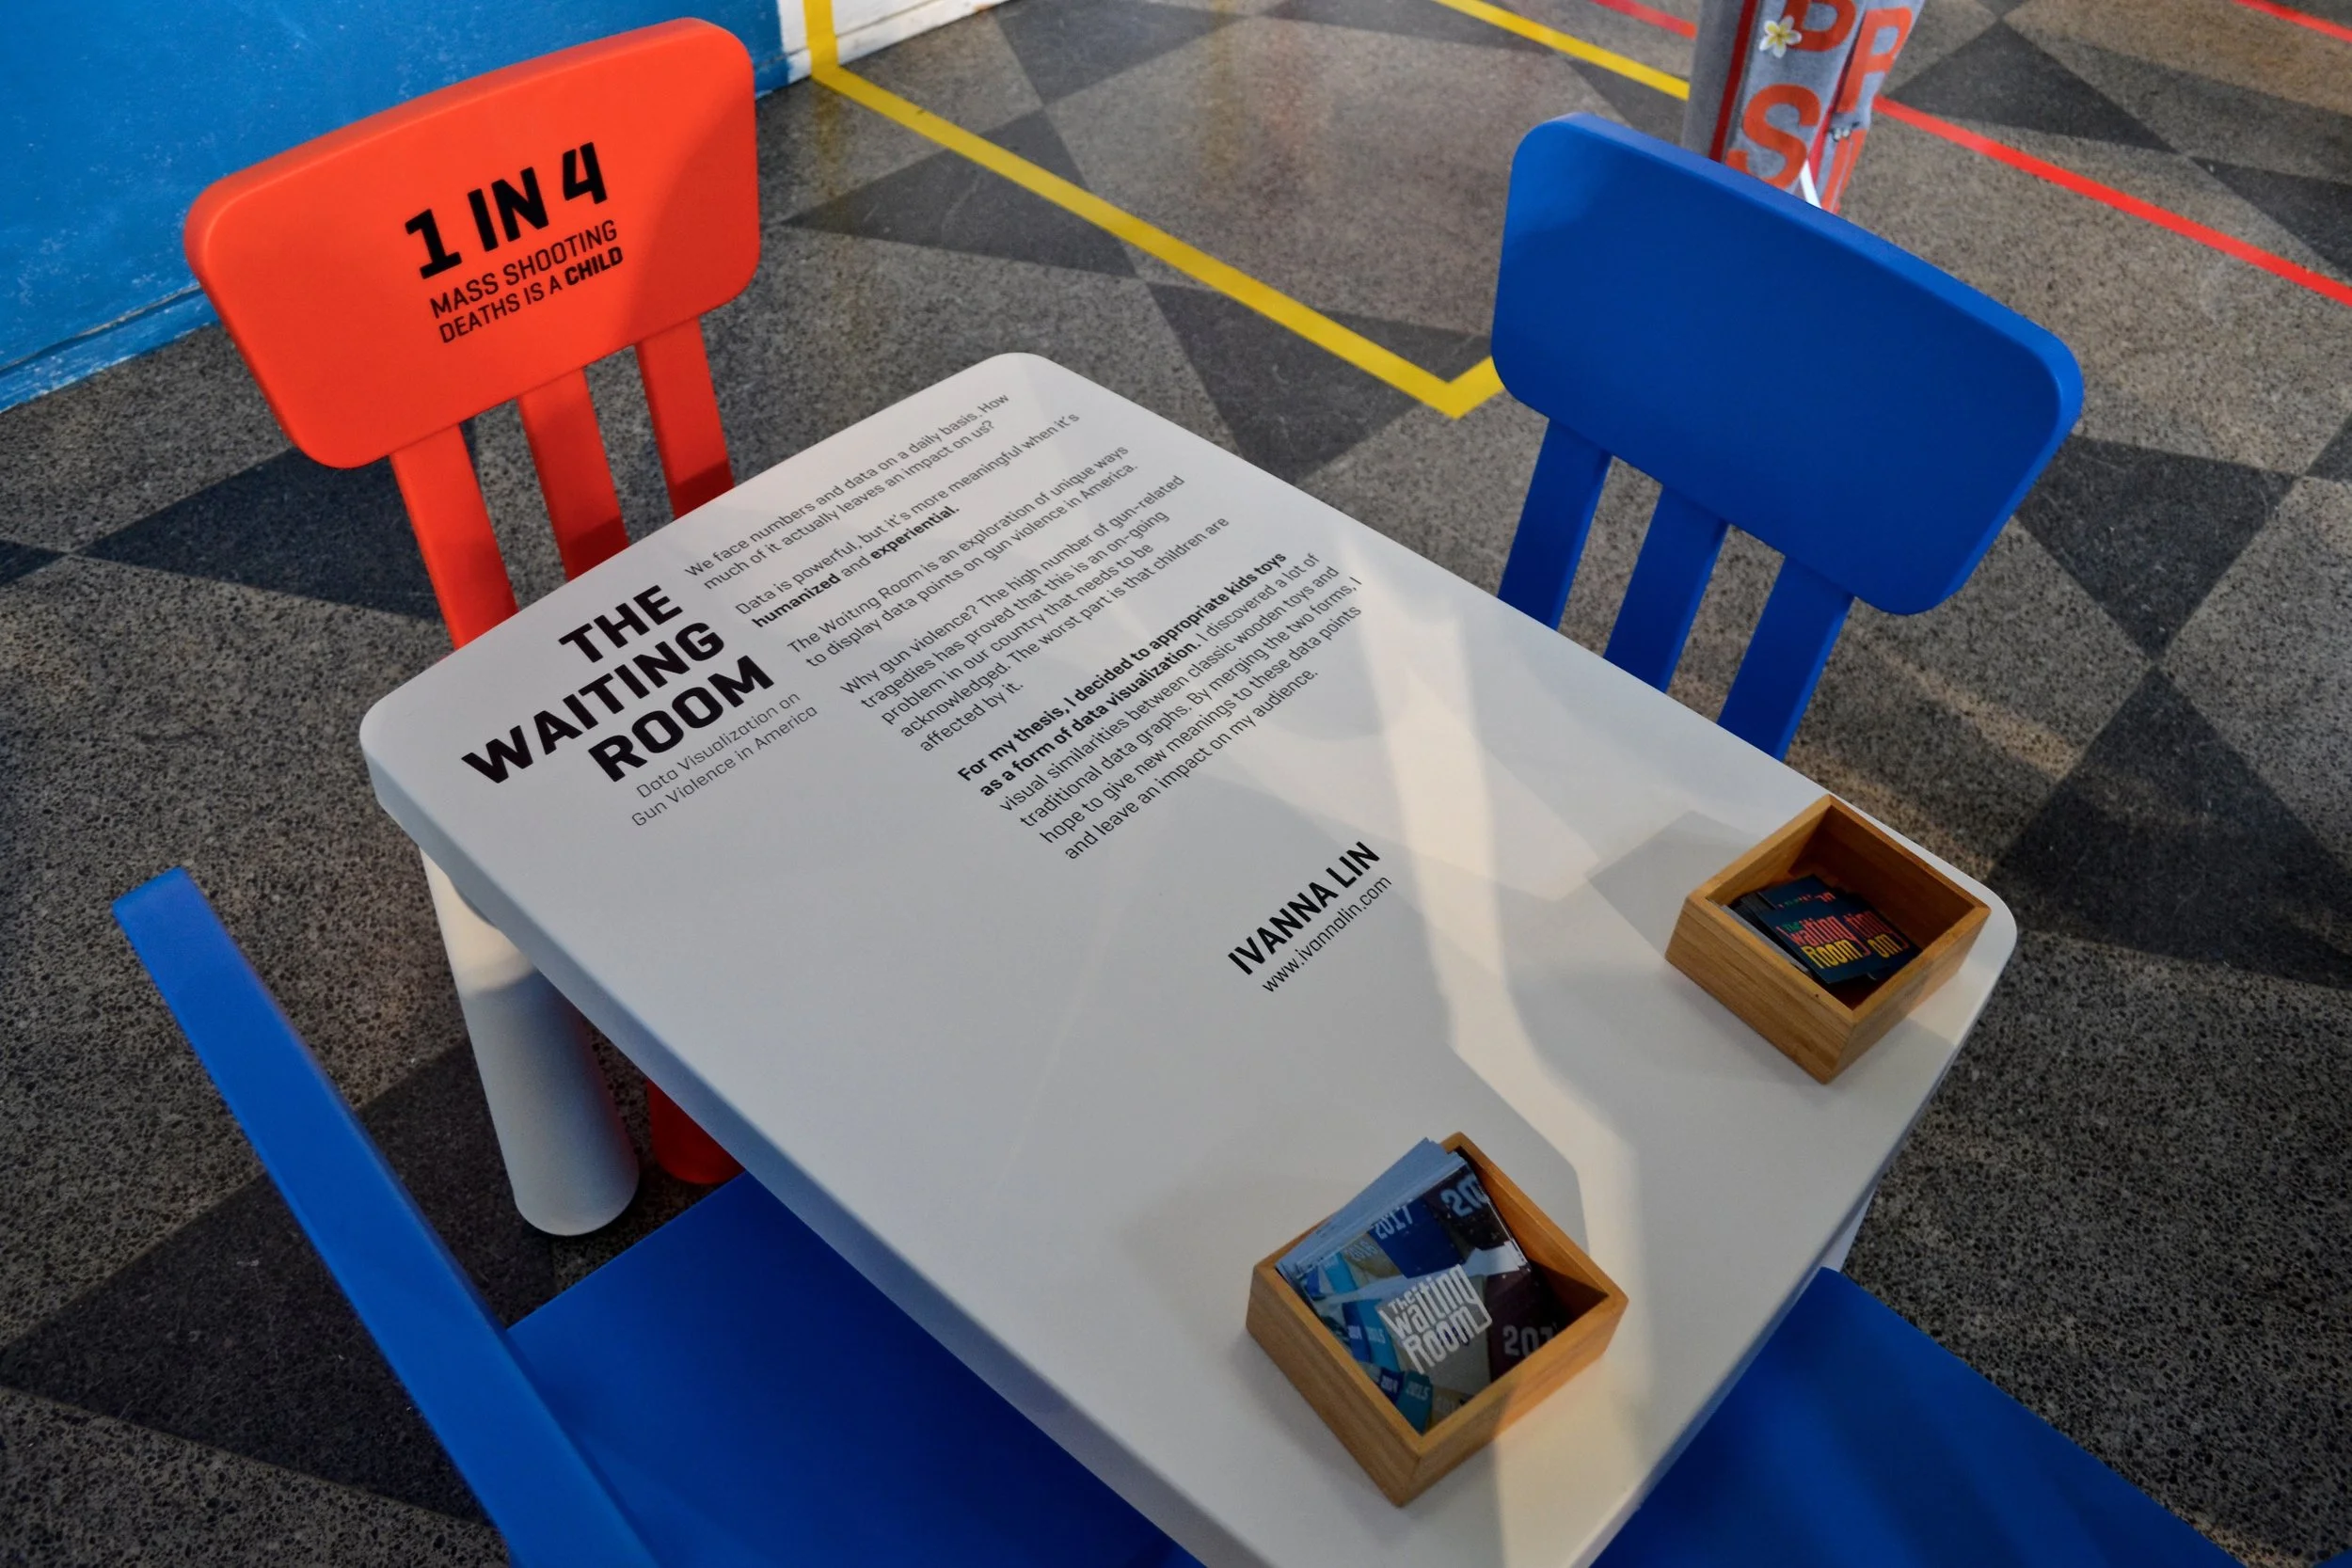
1 in 4 Mass Shooting Deaths is a Child
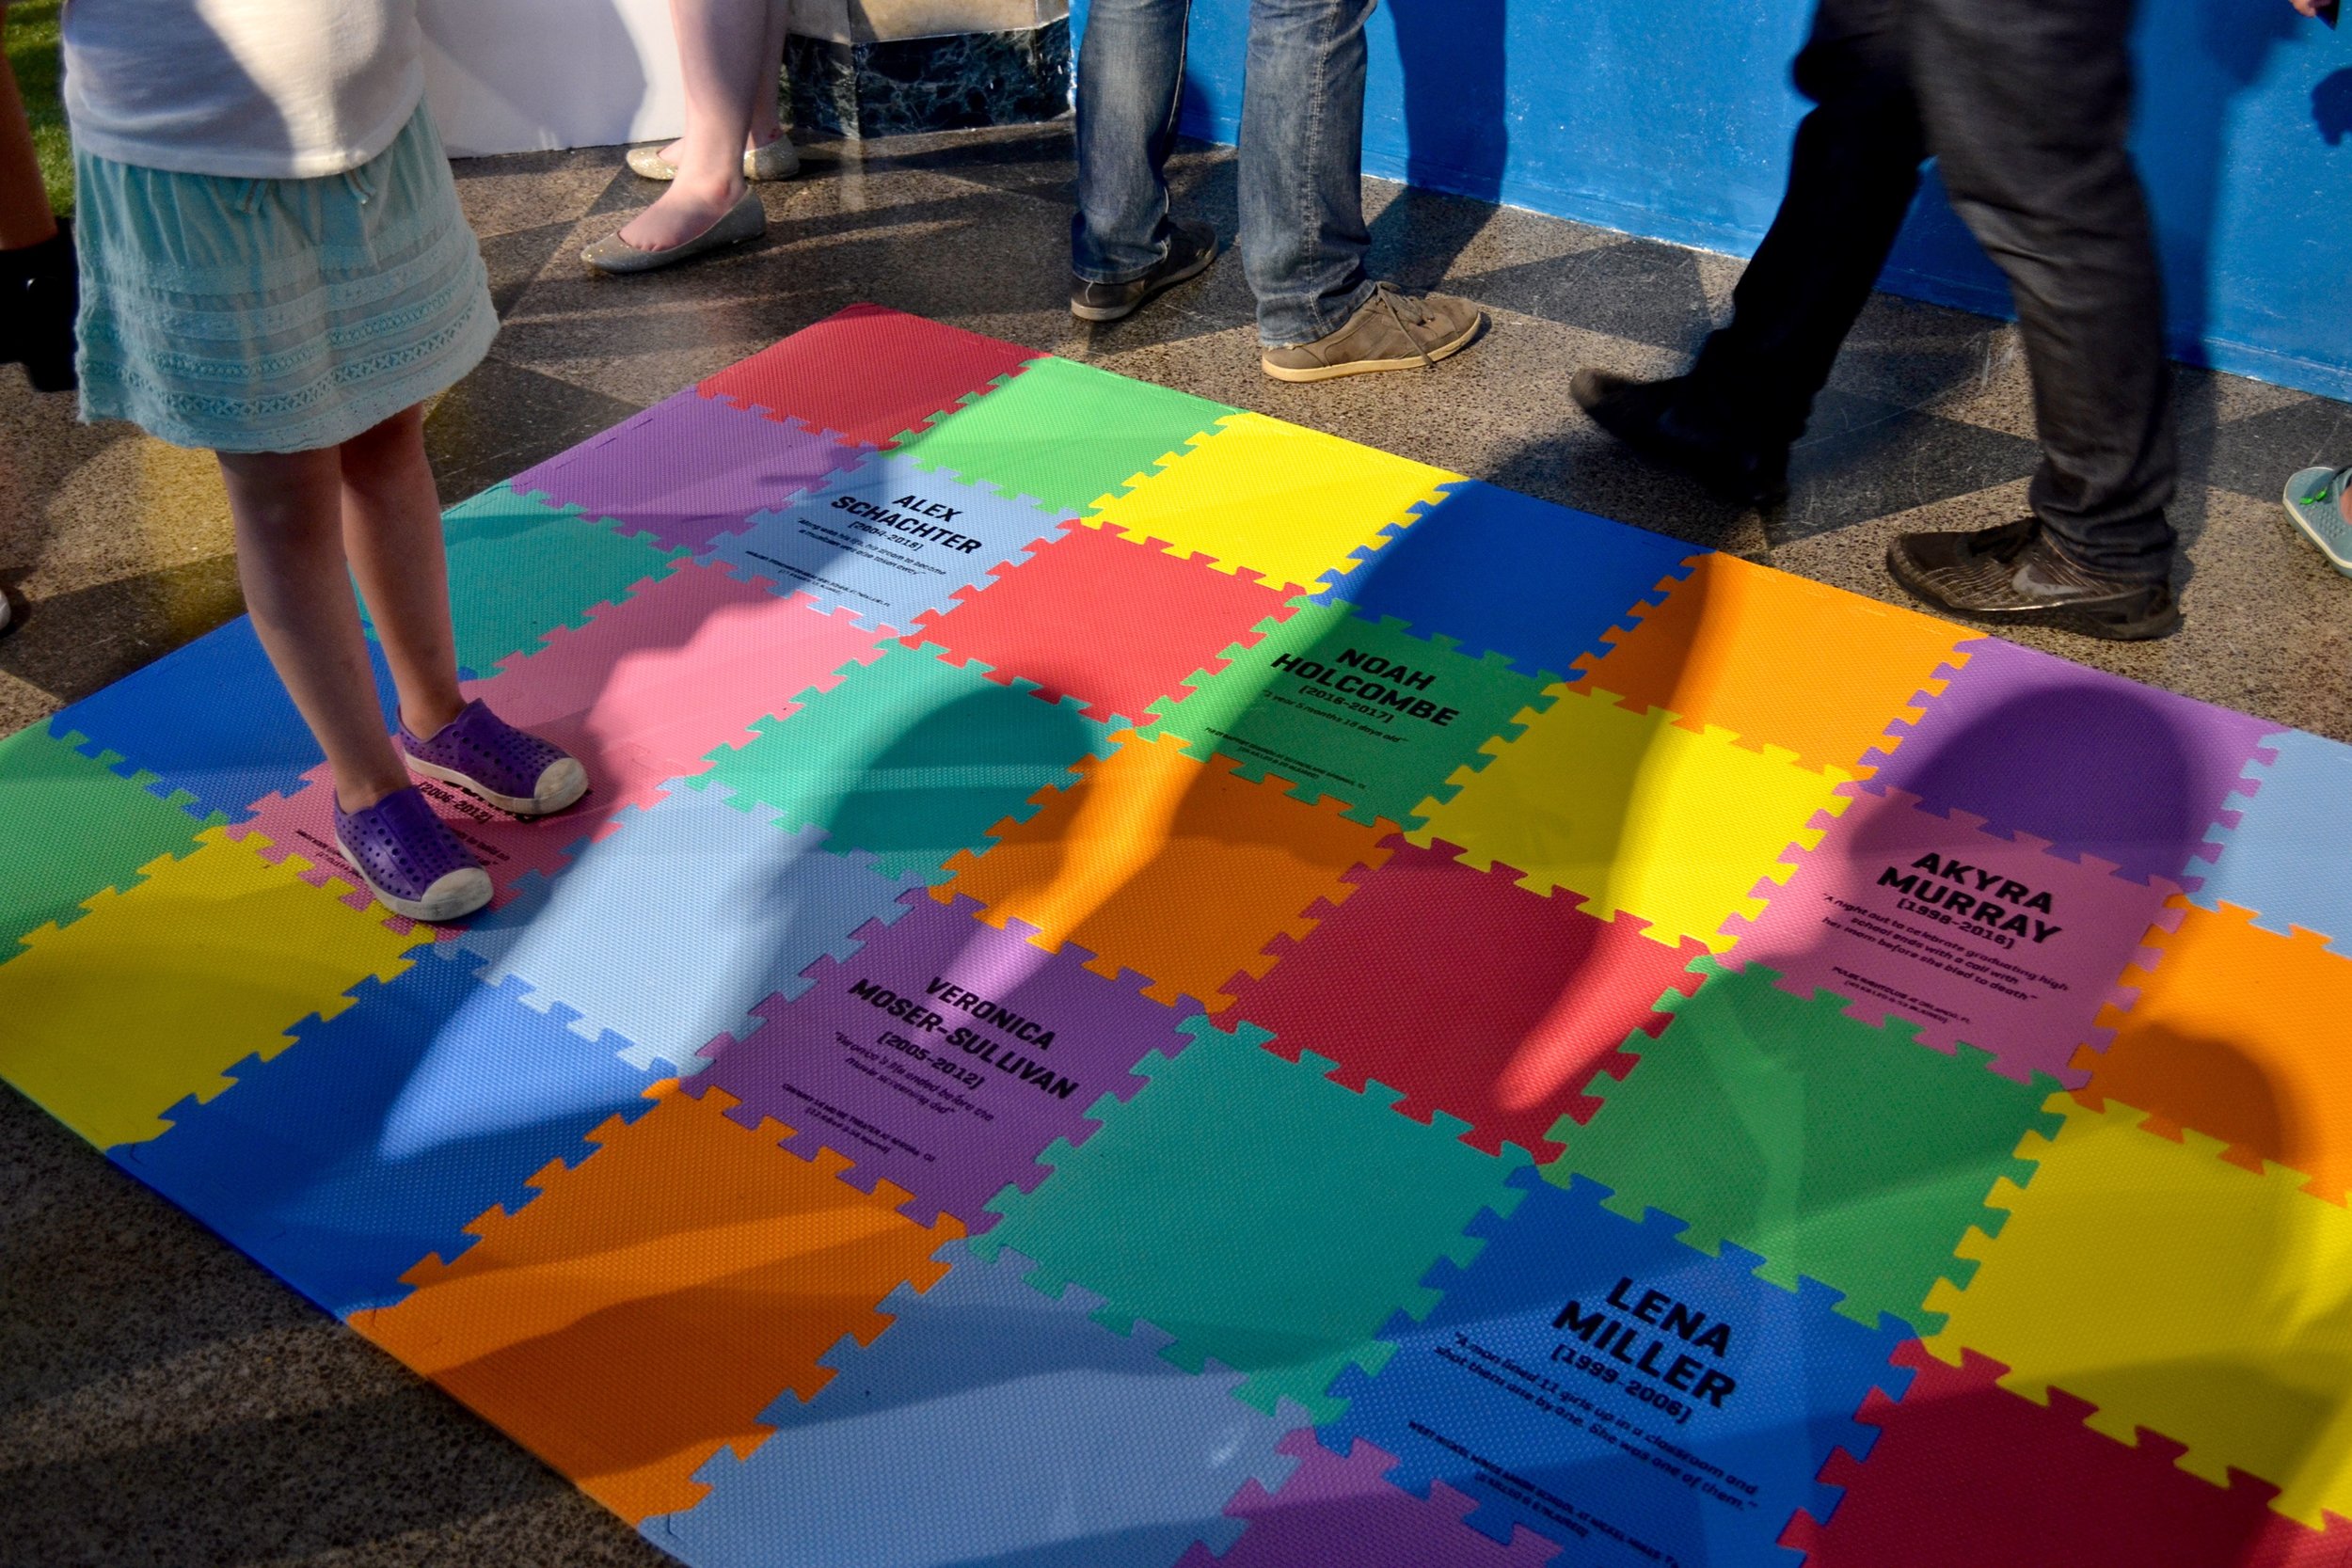
PLAYING MAT
Stories of Children and Teens Affected by Gun Violence

